Published on and written by Cyril Jarnias
The Lithuanian real estate market has changed significantly over the past fifteen years. Following the price explosion before the 2008 crisis, the subsequent crash, and then a new phase of very rapid growth after 2020, the country has now entered a period of more moderate growth. But behind this apparent stability, the gaps between cities are widening. Comparing prices between Vilnius, Kaunas, Klaipėda, Šiauliai, Panevėžys, and smaller towns helps to understand where the real opportunities lie, as well as the areas that have become difficult to access for local households.
The analysis is based on statistical data from specialized sources such as Ober-Haus, the Bank of Lithuania, Properstar, and the Global Property Guide. It focuses mainly on apartments, which are more representative of the big city markets, but also includes a study of houses and rental yields.
A national market in moderate but still dynamic growth
The first contextual element is that prices continue to rise everywhere in Lithuania, although the pace is much less dramatic than in 2021–2022. The apartment price index in the five major cities (Vilnius, Kaunas, Klaipėda, Šiauliai, Panevėžys) increased by approximately 3.2% year-on-year in July 2024, after +6.7% a year earlier and over +22% in 2022. When adjusted for inflation, the real increase remains positive, around 2.3%.
The nominal residential real estate price index reached a historic record of over 300 points in mid-2025.
This dynamic is explained by a mix of factors: continued urbanization, an influx of new residents (notably Ukrainians and other foreigners), wages rising faster than prices in several regions, and especially a structural supply deficit. Housing starts and completions are declining, while demand remains strong. In 2023, for example, the number of completed dwellings decreased by about 9%, and building permits fell by over 25%.
Within this tight framework, price geography becomes crucial for both buyers and investors.
Vilnius: a leading, expensive, and increasingly selective market
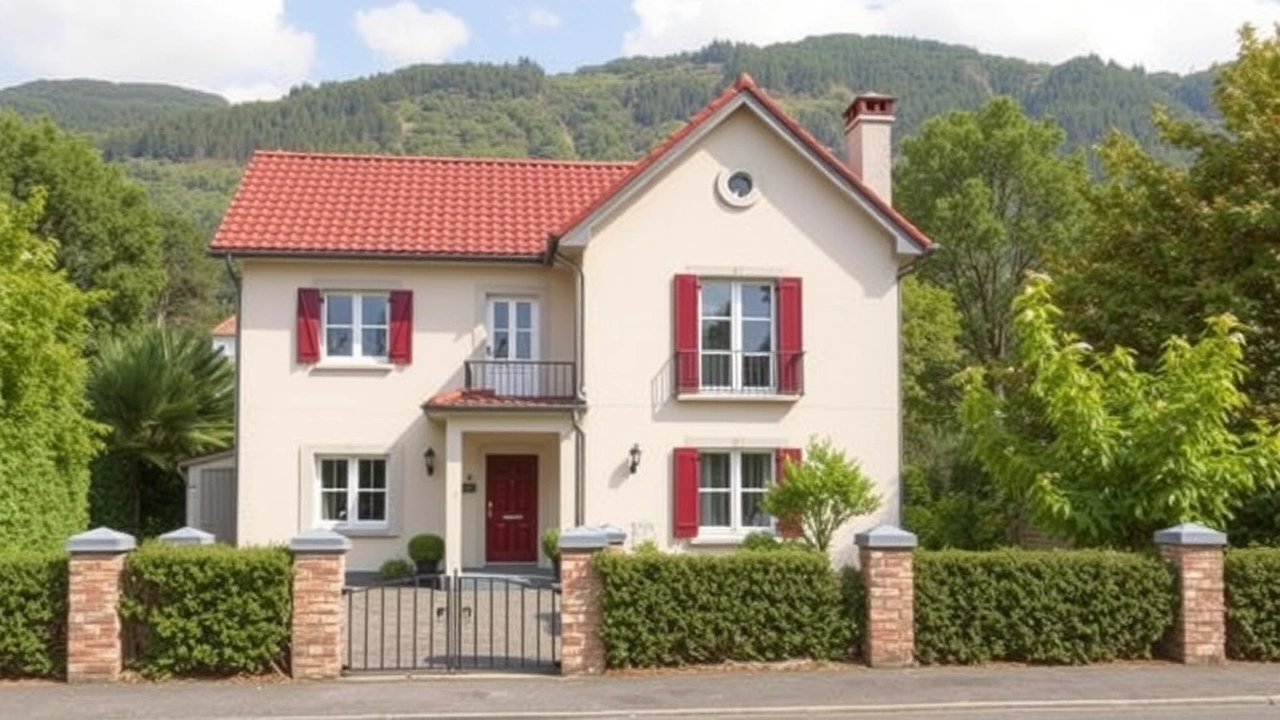
It is impossible to talk about Lithuanian real estate without starting with the capital. Vilnius concentrates economic power, the majority of skilled jobs, and a significant flow of students and expatriates. Unsurprisingly, it is also the most expensive city in the country.
Price levels in Vilnius: the high end of the national range
Figures vary slightly depending on sources and methodology, but the orders of magnitude converge. On one hand, Ober-Haus statistics cite standard apartments at around €2,600 to €2,700 per m² at the beginning of 2025. On the other hand, analyses aimed at “investors” or “property pack”-type products indicate an average apartment price of around €4,937 per m², with central districts easily exceeding €6,000 per m² for premium properties.
Even sticking to a purely average residential approach (Ober-Haus), the gap with other cities remains clear.
Comparison of average apartment prices (March 2025)
| City | Average Apartment Price (€/m²) |
|---|---|
| Vilnius | 2,680 |
| Kaunas | 1,846 |
| Klaipėda | 1,752 |
| Šiauliai | 1,172 |
| Panevėžys | 1,149 |
It shows that Vilnius is approximately 45 to 50% above Kaunas or Klaipėda, and more than double small towns or rural areas, where prices for standard apartments hover around €1,000–€1,200 per m², or even €800–€1,200 for the countryside.
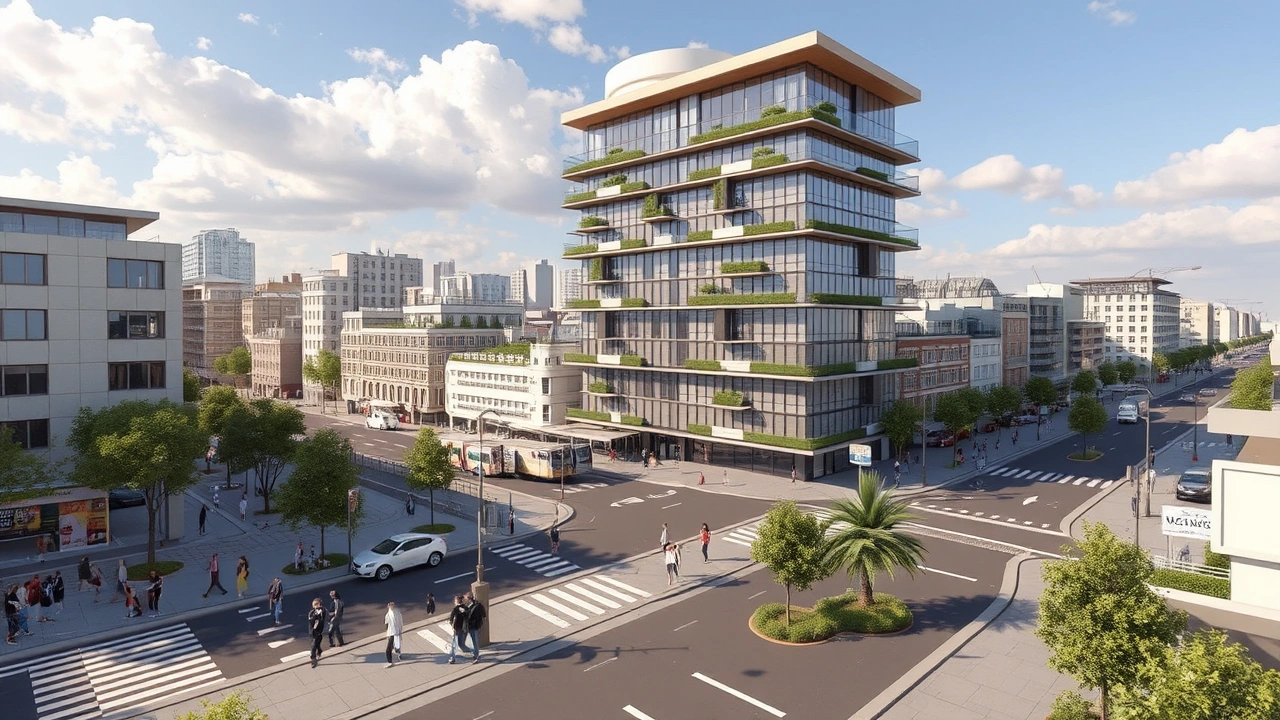
Average price per square meter for new buildings in Vilnius, representing a 25 to 35% premium compared to renovated Soviet-era apartments.
Vilnius: a closer look at prices per m² by neighborhood
The following ranges illustrate the internal “gradient” of the capital well:
| Neighborhood / Type of Area | Approximate Price (€/m²) |
|---|---|
| Old Town (historic center) | 3,800 – 7,000 |
| Naujamiestis | 2,800 – 4,200 |
| Žvėrynas | 2,900 – 4,500 |
| Šnipiškės | 2,600 – 3,800 |
| Antakalnis | 2,200 – 3,200 |
| Affordable Districts (Pilaitė, Fabijoniškės…) | 2,500 – 3,500 |
With a budget of €150,000–€200,000, buyers are often limited to the outskirts (Pilaitė, Fabijoniškės, Pašilaičiai) for a modern 1–2 room apartment, or a micro-studio in the center. Between €200,000 and €300,000, one can access decent 2-room apartments in up-and-coming neighborhoods like Naujamiestis or Šnipiškės, or family subdivisions in Baltupiai. Beyond €400,000, one starts to look at large apartments or houses in the capital’s premium areas.
Houses in Vilnius: expensive in the city, more affordable in the suburbs
Properstar data further refines the analysis for houses, converting prices to square foot (sq ft). In Vilnius city, the median price is about €365/sq ft for houses, compared to €469/sq ft for apartments. Converted to m² (1 m² ≈ 10.76 sq ft), this remains in an order of magnitude close to €3,800–€4,000 per m² for houses, consistent with overall figures.
In the Vilnius district municipality, covering the greater suburbs, the price of houses drops significantly to about €245/m², representing a decrease of about 8% year-on-year. This gap illustrates the considerable premium for properties located within the city proper.
A simple table summarizes the situation in Vilnius County:
| Area (Vilnius County) | Type | Median Price (€/sq ft) | Recent Change |
|---|---|---|---|
| Vilnius (city) | Apartment | 469 | +2 % |
| Vilnius (city) | House | 365 | +3 % |
| Vilnius District (suburbs) | House | 245 | –8 % |
Even when moving away, the capital remains the most expensive area in the county, both for apartments and houses.
A tight rental market, with moderate yields
On the rental front, Vilnius also stands out. Demand is fueled by young professionals, international students, expatriates from the tech sector, and families from Ukraine, Belarus, or Russia. Rents soared between 2021 and 2023: +9.5% in 2021, +26.7% in 2022, and another +10.2% in 2023. At the same time, the supply of apartments for rent decreased by 5 to 10%, as some landlords shifted to sales or longer-term rentals.
At the end of 2023, the order of magnitude for Vilnius was as follows:
| Property Type (Vilnius) | Typical Monthly Rent (€) |
|---|---|
| Old 2-room, residential areas | 380 – 540 |
| New 2-room, residential areas | 580 – 720 |
| Furnished 2-room, city center | 470 – 1,000 |
| 3-room (various areas) | 650 – 1,700 |
| Large Old Town apartment | 2,000 – 3,000 |
| House / villa in prestigious neighborhoods | 1,500 – 4,000 (high-end apartments); 5,000 – 6,000 (houses) |
More recent data, based on cost of living surveys, confirms these levels: a 1-room in the center is around €740 (range €600–€800), a 3-room about €1,270 in the center. Rents therefore remain high for local households, with a price-to-rent ratio around 34 in the center, implying it would take over 30 years of rent to “repay” the purchase price.
Regarding yield, this price level mechanically weighs down returns. According to various studies:
– Gross residential yields in Vilnius hover around 4.9–5.7% on average.
– Small apartments (studios) are typically around 5.2–5.3%, with pockets potentially reaching 7–8% in some emerging neighborhoods.
– Large central 2-room and 3-room apartments show weaker yields, often between 4.0 and 4.5%.
In national comparisons, Vilnius is the major city with the weakest rental yields, precisely because prices have risen faster than rents there.
Finally, affordability remains a sensitive issue. Numbeo indicators, for example, give a price-to-income ratio of 13.3 for Vilnius, a mortgage payment burden close to 100% of net income for a typical profile, and a mortgage affordability index around 1, signaling that many households are reaching their solvency limits.
Kaunas: more affordable prices and better yields
The country’s second-largest city, Kaunas plays a key role as a counterweight to the capital. It is a university city (about 40,000 students), a well-located logistics and industrial hub, and a city attracting more and more investment, including foreign.
Prices about 30% lower than in Vilnius
Price levels show a clear discount compared to the capital. In March 2025, apartments sold for an average of around €1,846 per m² in Kaunas, compared to €2,680 in Vilnius. Other sources place the city center between €2,500 and €4,000 per m², which remains significantly lower than the central districts of the capital.
Focusing on “standard apartments” (excluding luxury), we can summarize as follows:
| City | Average Standard Apartment Price (€/m²) | Discount vs. Vilnius |
|---|---|---|
| Vilnius | 2,600 – 2,700 | — |
| Kaunas | 1,800 – 1,850 | ≈ –30 % |
New developments are also less expensive. While Vilnius shows €3,300–€3,500 per m² for new builds, Kaunas often sees €1,200–€2,000 per m² for recent construction outside the hyper-center. This translates to better affordability for young households and investors seeking a lower entry ticket.
A market growing faster than the capital
Another interesting point: price growth is currently faster in Kaunas than in Vilnius. Year-on-year (July 2024), apartments there gained about 3.5%, compared to 2.2% for the capital. In recent periods, some years have even exceeded 4–5%.
This dynamic is explained by:
– strong local demand (population growth, rising employment, infrastructure projects like “Science Island,” bridges, cultural centers),
– the arrival of foreign investors (Estonia, Nordic countries, France…),
– and the “spillover” of buyers turning away from Vilnius, deemed too expensive, for a more affordable market offering further potential for appreciation.
Sales figures confirm resilient activity, even though 2023–2024 saw adjustments. The volume of new apartments built was very high in 2022–2023, with over 1,000 units per year, a record for the city since 2008, before slowing in 2024.
Rental yields: an interesting compromise between risk and profitability
For investors, Kaunas is often perceived as an excellent compromise. Rents remain high, notably due to the presence of universities, a developing tech sector, and many international companies, while purchase prices remain significantly lower than in Vilnius.
The available yield data allows for a synthesis and clearly illustrates the situation described in the article, providing a concise overview of the observed performance or results.
| City | Average Gross Apartment Yield |
|---|---|
| Vilnius | ≈ 4.9 – 5.7 % |
| Kaunas | ≈ 5.8 – 6.4 % |
In detail, studios can reach around 7% gross yield, 1-room apartments a little above 5%, and family 2-room or 3-room apartments around 5.2–5.9%. The differential of 1 to 1.5 percentage points in yield compared to Vilnius is significant for investors looking to balance capital and cash flow.
Rents themselves are well below those of the capital, making housing access more sustainable for residents:
– 1-room: around €450–€600 per month depending on location,
– 3-room: about €500–€800 per month on average.
Despite these lower amounts, rental profitability remains higher thanks to the lower purchase cost.
Klaipėda: the Baltic Sea as a real estate driver
Klaipėda, the country’s main port and major coastal city, holds a particular position in the Lithuanian real estate landscape. Prices there are close to those of Kaunas, but the local economy, heavily linked to the port and Baltic tourism (sea, nearby resorts like Palanga), creates a different demand structure.
Prices still lower than Vilnius, but rising sharply
In March 2025, apartments in Klaipėda sold for an average of around €1,752 per m², and €1,704 per m² in July 2024, placing it slightly below Kaunas. New construction generally trades between €1,200 and €1,500 per m², with premium areas potentially approaching €2,000–€2,200 per m².
This was the highest year-on-year increase in apartment prices in July 2024 among the five major Lithuanian cities.
High rental yields thanks to tourism and the port
On the rental side, Klaipėda stands out with average gross yields of about 6.2%, higher than Kaunas and well above Vilnius. Studios often approach 6.7%, and 2-room apartments around 6.2%.
Several factors explain this performance:
– solid demand linked to the port, logistics, and industry,
– seasonal tourist flow attracted by the coast, boosting short-term rentals,
– purchase prices still reasonable relative to local incomes and rents.
For income-oriented investors, it is one of the most attractive cities in the country, even though seasonality (very strong summer, quieter winter) requires finer rental management, especially for vacation rentals.
Šiauliai and Panevėžys: low prices, high yields
Beyond the trio Vilnius–Kaunas–Klaipėda, the two other major cities, Šiauliai and Panevėžys, occupy a very different niche: that of maximum profitability with low prices, at the cost of lower liquidity and market depth.
Prices still much lower than in the major cities
The figures speak for themselves. In March 2025, apartments sold for an average:
– in Šiauliai: around €1,172 per m²,
– in Panevėžys: around €1,149 per m².
In July 2024, prices per square meter were very similar in Šiauliai (€1,131) and Panevėžys (€1,109). With the same budget, a buyer can acquire an area almost twice as large in Šiauliai as in Vilnius.
Recent growth is nonetheless robust: Šiauliai and Panevėžys record annual increases of 6.4–6.7%, higher than Vilnius or Kaunas. A catch-up is therefore underway, even if the absolute gap remains large.
Record rental yields… with some caveats
The counterpart to these modest prices is particularly high gross rental yields. Data from the Global Property Guide and other observers report:
| City | Average Gross Rental Yield |
|---|---|
| Šiauliai | ≈ 8.2 % |
| Panevėžys | 7 – 9 % depending on property type |
Šiauliai studios can reach over 9% gross yield, 1-room apartments around 7.3%. In Panevėžys, recent projects or renovated apartments in central districts regularly show 7–9%.
However, these performances must be balanced against several realities.
– a less liquid resale market than in major cities,
– a more limited economic base,
– a rental demand that is quite stable but less diversified (fewer expatriates, little international tourism).
For a pure “cash-flow” oriented investor, these cities can be very attractive. For an owner-occupier buyer, they represent a way to become a homeowner at very low cost, but often at the price of distance from certain services or job opportunities.
Comparison of major cities: prices, growth, and yields
To measure gaps on a national scale, it is useful to juxtapose some key indicators, as of mid-2025.
Summary of prices and yields by city
| City | Avg. Apt. Price (€/m²) | Recent Annual Growth | Avg. Rental Yield |
|---|---|---|---|
| Vilnius | ≈ 2,680 | ≈ +3.3 % | ≈ 5 % (4.9–5.7 %) |
| Kaunas | ≈ 1,846 | ≈ +4.1–5.6 % | ≈ 6 % (5.8–6.4 %) |
| Klaipėda | ≈ 1,752 | ≈ +5.4–6.3 % | ≈ 6.2 % |
| Šiauliai | ≈ 1,172 | ≈ +6.4 % | ≈ 6.8–8.2 % |
| Panevėžys | ≈ 1,149 | ≈ +6.7 % | 7–9 % |
This table highlights three main city profiles:
Comparative overview of Lithuania’s main cities in terms of prices, growth, and yields for real estate investment.
Highest price level. Positive but less rapid growth than some regional cities. Lowest yields. A market of security and prestige, with accessibility questions.
Intermediate prices with sustained growth and solid yields. Represent the best compromise between capital appreciation and rental cash flow.
Very low prices with strong recent growth (catch-up effect). High gross yields. Profile oriented towards income-seeking investors or local households looking for minimal access cost.
Another important dimension of the comparison between cities concerns the price gap between new and older real estate.
In Vilnius, the differential reaches about 27–35%: new constructions, often in energy class A or A+, are listed around €3,300–€3,500 per m², compared to €2,600–€2,700 for older apartments. This premium is justified by better energy performance, modern finishes, and very strong demand for new mixed-use neighborhoods (offices + housing).
In other major cities, the new-build premium exists, but remains more moderate. On average:
In Kaunas, the price per m² for a new apartment (€1,200–€2,000) can be very close to, or even slightly above, the overall standard price including renovated older stock (€1,800–€1,850). In Klaipėda, many new projects are between €1,200 and €1,500 per m², a price sometimes barely above the existing housing stock.
In small towns and rural areas, the contrast is even more striking. New builds often sell for 2.5 times more than second-hand houses: for example, around €1,500–€1,555 per m² for new apartments versus €725 per m² for older ones. This creates a two-tier market, where only certain households or investors can turn to new builds.
Influence of incomes, interest rates, and demography
Comparing cities solely via raw prices is insufficient. These amounts must also be put into perspective with local incomes, the cost of credit, and population trends.
Wages are rising, but affordability remains tight in Vilnius
Nationally, the average net salary is around €1,550–€1,600 per month. Vilnius is above this average, with higher average incomes, while regional cities remain slightly below.
Despite this progression, the gap with real estate prices has widened in the capital. Various indicators show that:
– the share of income dedicated to housing (mortgage) often reaches 25–30% of gross income for borrowing families in Vilnius,
– only about half of households can reasonably buy a home without exceeding 30% of their disposable income for housing,
– renting an average 2-room in the capital (about €900) already represents a substantial portion of the median salary.
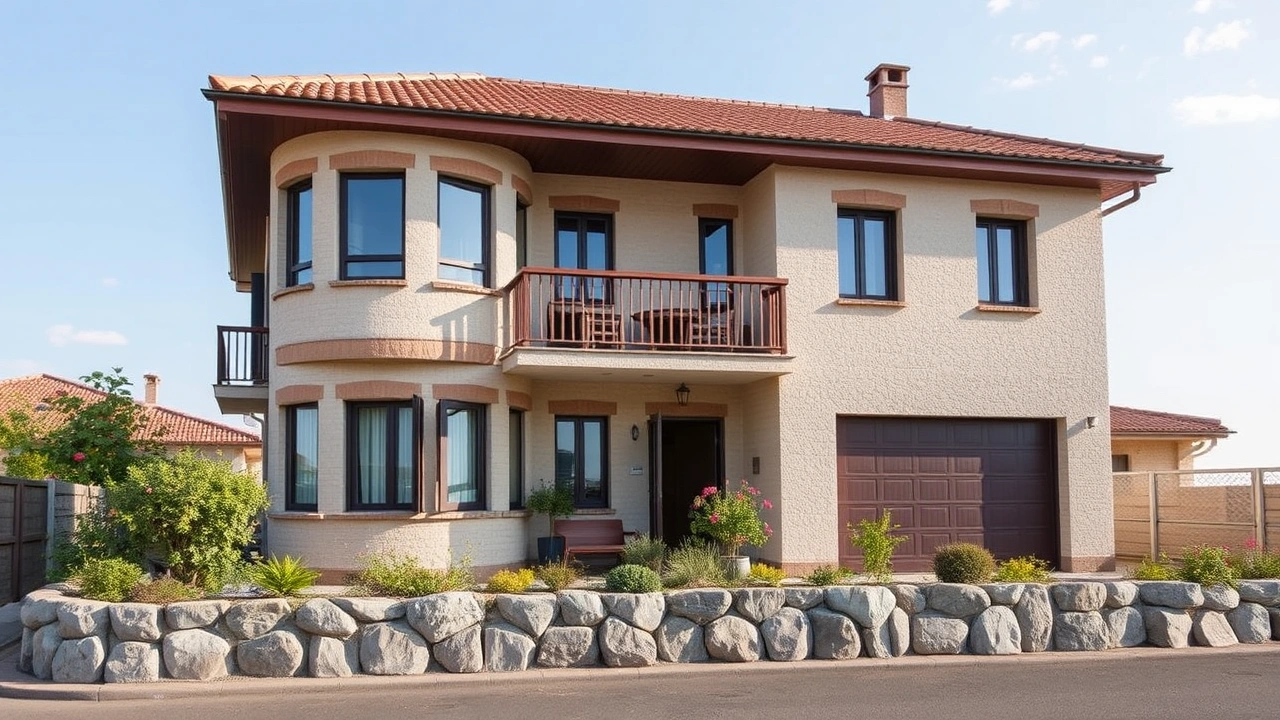
This is the homeownership rate at the national level in France, one of the highest in the OECD.
Interest rates: a temporary brake, but not a crash
Another key parameter: the cost of credit. After a period of very low rates, the rise in Euribor rates has increased the cost of mortgage loans. In Lithuania, new loans are generally signed at around 5–6% in 2024–2025, compared to barely 2–3% a few years earlier. The average rate for new loans was around 5.3–5.4% in the summer of 2024.
This increase has had two effects:
– a slowdown in the number of new loans (about €145M of new loans per month in 2023 versus €180M previously),
– a dip in transaction volumes, particularly in new builds.
Despite rising interest rates, real estate prices have not experienced a sharp correction. This resilience is mainly due to supply scarcity, rising wages, and sustained economic growth, with a GDP growth forecast around 2.8% in 2025. The market has thus slowed its progression rather than undergoing a sharp reversal.
Urbanization and internal migration
Finally, the demographic trajectory largely explains the differentiation between cities. About 68% of the Lithuanian population lives in urban areas, and the trend is towards concentration in large centers, first Vilnius and Kaunas, but also Klaipėda. The population of Vilnius passed the 600,000 inhabitant mark in 2023, with growth close to 3% in that year alone, supported by the arrival of expatriates, students, and Ukrainian refugees.
This dynamic continuously fuels housing demand, for both ownership and rental, in the three major cities. Conversely, many small towns and rural areas are still losing residents or gaining very few, which explains the maintenance of very affordable prices despite the overall market rise.
Where to buy based on your profile: capital, major cities, or small towns?
All the data highlights a simple reality: there is no “one” Lithuanian real estate market, but several markets, highly differentiated geographically.
– For a household looking to live at the best cost, Šiauliai, Panevėžys, and some small towns or peri-urban areas represent the most economical option. Prices there are low, rental yields are high if one wishes to rent out part of the property, but the prospects for quick resale and strong capital gains are more uncertain.
For a balanced investor, who wants to combine appreciation and yield, Kaunas and Klaipėda stand out as the best compromises. Prices remain reasonable compared to Vilnius, growth is currently faster, and rental yields often flirt with 6–7%. These cities also benefit from infrastructure projects and a diverse economic fabric (universities, special economic zones, port, industry…).
– For a long-term investor oriented towards prestige and security, or for a household wishing to live at the heart of tech and cultural dynamism, Vilnius remains essential. The entry cost is significantly higher, rental yields are less generous, and affordability is a challenge, but the market depth, durable rental demand, and quality of infrastructure make it the country’s stronghold.
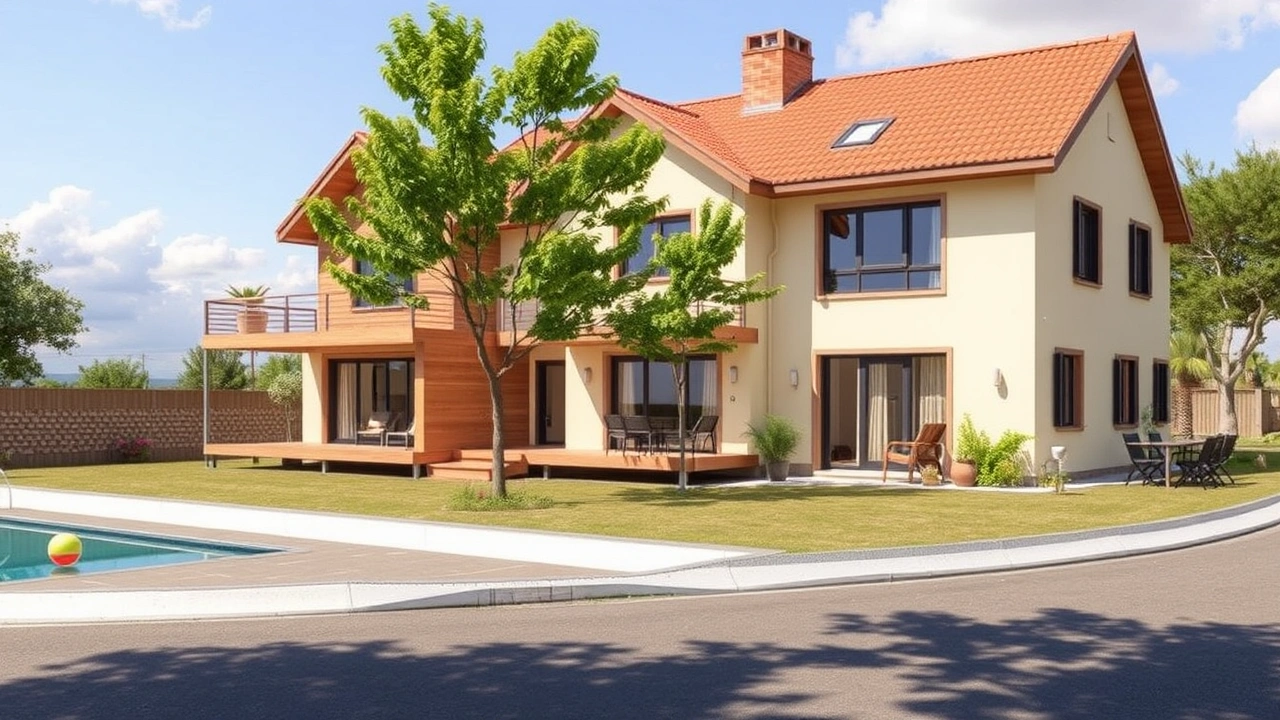
This is the surface area in square meters of a typical house with a 1000 m² plot available on the outskirts of Vilnius.
Conclusion: a stabilized market, but growing gaps between cities
Taking a step back, Lithuania today finds itself in a unique situation. Real estate prices have more than doubled since the early 2010s, and even after the slowdown of 2023–2024, the trend remains clearly upward. Yet, this movement is not happening uniformly.
Vilnius continues to pull the market upward in absolute value, but the strongest recent increases are now observed in Klaipėda, Šiauliai, and Panevėžys. Rental yields are the weakest in the capital and the highest in small regional towns. Kaunas and Klaipėda, in the middle of the table, combine many of the strengths of each model.
Several forces will shape the market: continued urbanization, investments (Rail Baltica, projects in Vilnius/Kaunas), evolution of interest rates, and regional growth differentials. The figures show that comparing prices between cities mainly illustrates a quasi-autonomous capital market, while other cities seek a balance between affordability, attractiveness, and profitability.
For buyers and investors alike, the challenge is no longer just whether the Lithuanian market is “expensive” or “affordable”, but rather in which city, in which neighborhood, and for which life or investment project.
Disclaimer: The information provided on this website is for informational purposes only and does not constitute financial, legal, or professional advice. We encourage you to consult qualified experts before making any investment, real estate, or expatriation decisions. Although we strive to maintain up-to-date and accurate information, we do not guarantee the completeness, accuracy, or timeliness of the proposed content. As investment and expatriation involve risks, we disclaim any liability for potential losses or damages arising from the use of this site. Your use of this site confirms your acceptance of these terms and your understanding of the associated risks.
Cyril Jarnias is an independent expert in international wealth management with over 20 years of experience. As an expatriate himself, he is dedicated to helping individuals and business leaders build, protect, and pass on their wealth with complete peace of mind.
On his website, cyriljarnias.com, he shares his expertise on international real estate, offshore company formation, and expatriation.
Thanks to his expertise, he offers sound advice to optimize his clients' wealth management. Cyril Jarnias is also recognized for his appearances in many prestigious media outlets such as BFM Business, les Français de l’étranger, Le Figaro, Les Echos, and Mieux vivre votre argent, where he shares his knowledge and know-how in wealth management.