
 Published on and written by Cyril Jarnias
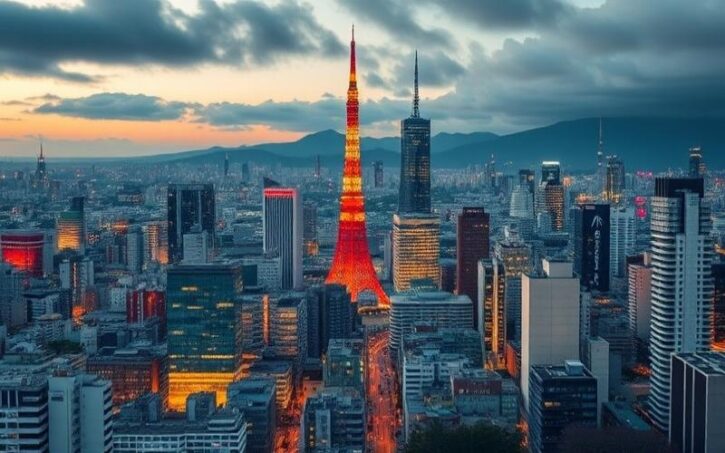
Investing in real estate in Tokyo means entering one of the most dynamic, liquid, and monitored markets in the world. As Japan’s economic capital, the world’s top metropolis by GDP, and a financial hub in Asia-Pacific, Tokyo concentrates a population of over 37 million in its greater region. All within a politically stable country, very open to foreign ownership, and still marked by historically low interest rates compared to international standards.
Despite its image as a safe haven, the Tokyo real estate market presents challenges: modest gross yields, record prices in central districts, tenant-friendly rental legislation, and tax pressure to anticipate. The UBS index also points to a bubble risk. For an investor, it is crucial to define precisely where, how, with what objective, and at what price to invest.
This article provides a structured overview of the Tokyo market, yields by ward, price trends, tax schemes, and financing options, with a resolutely practical angle to help build a coherent investment strategy.
A structurally solid market, boosted by the weak yen and foreign capital
Tokyo ticks almost all the boxes that reassure institutional investors: a strong rule of law, high transparency, few restrictions on foreign ownership, world-class infrastructure, low vacancy rates, and sustained rental demand.
Nationally, the Japanese real estate market was valued at around $436 billion in 2024, with a projection of $557 billion by 2033, representing an average annual growth of around 3%. On the macroeconomic side, nominal GDP is rising, inflation is stabilizing around 2% to 4%, and wages are increasing by 3% to 5% in large companies, supporting household solvency.
Residential investment by foreign players in Japan reached 740 billion yen in 2024, up 18% year-on-year.
For an investor in strong currencies, the weak yen provides immediate leverage: for an equivalent budget, the purchasable floor space in Tokyo is often larger than in places like Hong Kong or Singapore. Some calculations show that with $1 million, a buyer can get about 64 m² in Tokyo in good neighborhoods, compared to significantly less in other Asian hubs.
Prices soaring, but still considered “affordable” relative to other megacities
Price dynamics in Tokyo have been spectacular in recent years. After a long period of stagnation following the 1990s bubble burst, values have not only erased the shock of COVID-19 but have far exceeded their 2020 levels.
Price growth: the 2024–2025 update
Official indices measure this increase.
| Indicator | Annual change (January 2025) | Real change (inflation-adjusted) |
|---|---|---|
| Residential index – Tokyo metropolitan area | +8.14% | +3.95% |
| Housing price index – Tokyo prefecture | +10.7% | +6.42% |
Land prices follow the same trend. Average land prices rose by about 7.7% in Tokyo in 2025, with a jump of 11.2% for commercial land, and 5.6% for residential. In the 23 special wards, the increase reaches 13.2% for commercial land and 8.3% for residential, with a surge of 12.9% for the “five central wards.”
Some Tokyo neighborhoods are experiencing spectacular land price increases. For example, increases reach +16.3% in Nakano, +15.1% in Suginami, and +14.8% in the Asakusa area (Taito ward). The rise is particularly pronounced near the Shibuya Sakura Stage complex, with +32.7%. In Minato, residential land prices have even risen by nearly 50% over the past five years, illustrating a fundamental trend in the Tokyo real estate market.
In the apartment segment, the tension is even more visible. In the Tokyo metropolitan area, the average price of new apartments went from 67.32 million yen in 2015 to 111.81 million in 2024, representing a cumulative increase of 66%, with a sharp acceleration between 2022 and 2023 (+39% in one year).
In 2025, we observe:
| Market | Average price | Annual change |
|---|---|---|
| New apartments – Greater Tokyo (March 2025) | 104.85M JPY | +37.5% |
| New apartments – 23 wards (average 2024) | >110M JPY | +42.5% in 2023 |
| New apartments – 23 wards (April 2025) | 90M JPY | –7% vs April previous year |
| Existing apartments – 23 wards (April 2025) | 44.51M JPY | +28.3% |
Per unit of area, this translates to about 1.116M JPY/m² for new and 819,000 JPY/m² for existing in the metropolitan area at the start of 2025. In the most upscale neighborhoods like Minato or Chiyoda, prices commonly exceed 2M JPY/m², with resales of ultra-luxury residences between 8.8 and over 14M JPY/m².
Despite these figures, several analyses point out that Tokyo remains relatively “cheap” compared to New York or Hong Kong in terms of price per square meter, even though the legal framework is more favorable to foreigners than in most Asian countries.
Real estate market analyses
A spectacular upscaling of the luxury segment
The high-end segment is undergoing a profound transformation. The number of existing apartments listed for over 100 million yen in the 23 wards rose from about 2.6% of listings in 2019 to 15% in 2025: roughly one in ten existing homes is now “high-end.” Tokyo recorded 28 residential transactions above 500 million yen in 2024, an all-time high.
Ultra-luxury projects in neighborhoods like Roppongi, Azabu, Aoyama, or Omotesando fuel this momentum. Developments such as Aman Residences, MARQ Omotesando ONE, or Toranomon Hills trade at levels that rival the most expensive addresses globally. Forecasts suggest prices could reach 50–60 million yen per tsubo (roughly 15–18M JPY/m²) by 2030 in some iconic complexes.
Rental yields in Tokyo: where are the real opportunities?
One of the paradoxes of the Tokyo market is yields. While Japan is reputed to offer yields higher than many developed capitals, central Tokyo shows relatively modest gross rates, especially in the central wards.
The big picture: gross and net yield
Across the 23 wards, the average gross rental yield for existing properties stood around 4.22% in 2020, with an average rent close to 3,200 JPY/m² and a price around 900,000 JPY/m². Nationally, the average gross yield hovers around 4.2–4.3%.
In Tokyo, the generally observed ranges are as follows:
| Segment | Typical gross yield | Indicative net yield* |
|---|---|---|
| Apartments – Tokyo (average) | 3–5% | 1–3.5% |
| Central wards (Chiyoda, Chuo, Minato, Shibuya, Shinjuku) | 3.4–3.8% | 1.5–2% |
| Peripheral/suburban wards | up to 6% | 3.5–4.5% |
| Wooden multi-family buildings (Tokyo) | ~7.3% | 5–6% |
| RC multi-family buildings (Tokyo) | ~6.5% | 4.5–5% |
Net yields account for the fact that charges, management fees, maintenance, taxes, and vacancy typically reduce the gross yield by 1.5 to 2 points.
In practice, the best gross yields are found in the eastern and northern wards of Paris, far from the most prestigious addresses. Conversely, central areas offer lower yields but a solid outlook for capital preservation, or even appreciation.
Focus by ward: from yield to valuation
The yield figures by ward clearly show the polarization of the market. Below are some orders of magnitude from recent analyses.
High-yield wards
| Ward | Gross yield (2020) | Range (2024) | Indicative price (JPY/m²) | Profile |
|---|---|---|---|---|
| Edogawa | 5.17% | 4.8–5.5% | 450,000–700,000 | Family-oriented, riverbanks, ongoing development |
| Adachi | 5.03% | 5.2–6.0% | 450,000–650,000 (avg. 500,000) | High yield, low entry costs, farther from center |
| Katsushika | 4.84% | 5.0–5.8% | 400,000–600,000 | Popular shitamachi, good transport, stable rents |
| Itabashi | 4.65% | 4.5–5.2% | 500,000–750,000 (avg. 600,000) | Universities, mixed residential/commercial, good tenant base |
| Sumida | 4.26% | 4.5–5.0% | – | Up-and-coming area, Skytree/Asakusa, good transport |
These sectors, often perceived as less “glamorous,” nonetheless offer an interesting compromise for those seeking positive cash flow, especially with bank financing. They combine reasonable entry cost, moderate vacancy (3–5% on average in Tokyo), and yields above the city average.
Intermediate and popular family wards
| Ward | Typical yield | Indicative price (JPY/m²) | Positioning |
|---|---|---|---|
| Nerima | 4.3–5.0% | 550,000–800,000 (avg. 650,000) | Suburban, schools and parks, family clientele |
| Setagaya | 3.8–4.5% | 800,000–1,200,000 | Affluent residential, appreciation potential, family rents 250–400k JPY/month |
| Toshima | 4.0–4.5% | – | Affordable housing, good access (Ikebukuro) |
| Arakawa | 4.0–4.5% | – | Traditional atmosphere, moderate entry ticket |
Setagaya illustrates the “premium family” segment: high entry ticket, relatively modest gross yields, but strong market depth, reputation for quality of life, and good price resilience.
High-end city centers
| Ward | Typical yield | Price (new/existing – order of magnitude) | Characteristics |
|---|---|---|---|
| Shibuya | 3.2–3.8% (3–5% depending on type) | 1.2–2.0M JPY/m² (avg. 1.5M) | Hyper-central, tech & culture, very high rental demand |
| Minato | 3.0–3.6% (3–4%) | 1.5–2.5M JPY/m² (avg. 2M) | Embassies, corporate headquarters, high purchasing power, international market |
| Chiyoda | 2.8–3.5% | 1.8–3.0M JPY/m² (avg. 2.5M) | CBD, Imperial Palace, very low residential supply |
| Meguro | 3.5–4.2% | 1.0–1.5M JPY/m² | Chic residential, international, riverside |
| Nakano | – | ≈800,000 JPY/m² | Up-and-coming area, arts and neighborhood life |
In these districts, the strategy is clearly oriented toward capital appreciation rather than current yield. Rent levels illustrate the positioning: a 1-bedroom rents around 200,000 JPY/month in Shibuya, a 2-bedroom between 300,000 and 500,000 JPY/month in Minato. Vacancy rates are very low, especially for well-located properties.
Unit size and asset type: impact on yield
The property type strongly influences yield:
Overview of gross yields by location, unit size, and construction type, to guide investors.
Studios, 1K, 1LDK: gross yields of 3.4 to 4% in the center. Offer the best yields per m², with higher tenant turnover.
2LDK–3LDK: gross yield around 3.4%. Capture long-term demand (families, expats, executives).
Gross yields close to 8% nationally (7.3% in Tokyo). The most attractive product for a yield-seeking investor.
Gross yield around 6.5% in Tokyo.
Gross yield around 6% in Tokyo.
Regarding short-term rentals (like Airbnb), average figures for Tokyo show yields of only 2.5–3.5%, often lower than a standard lease once management costs and stringent regulations are factored in.
Supply, demand, and vacancy: why the equation remains favorable to landlords
Despite price pressure, the Tokyo rental market remains tight on the supply side.
An organized shortage of new housing
For several years, the number of new condo listings in the Greater Tokyo area has been declining or stagnating due to a combination of rising construction costs (nearly +30% since 2020), a shortage of skilled labor, and urban constraints. In 2024, only 23,003 new units were marketed in the metropolitan area, the lowest level since 1973. A slight recovery is anticipated for 2025 (around 26,000 units), but volumes remain well below past peaks.
The existing housing market is characterized by limited supply. New listings for existing condos have been declining for several months, and available inventory continues to erode. This structural scarcity supports sale prices and keeps rental vacancy rates very low.
Very high occupancy rates
In the 23 wards, the rental occupancy rate stands at around 96–97%, with an estimated peak of 97.2% at the end of 2024. Major management companies report extremely short average vacancy periods for well-located properties, sometimes just a few weeks.
Year-on-year increase in average mid-market rents in the 23 wards in Q4 2024.
Vacancy rates vary by segment:
– Overall residential rental market in Tokyo: around 3–5%,
– Luxury apartment market: vacancy around 7.3%, much lower than other major Japanese cities,
– Grade A offices in the five central wards: vacancy around 3.4% in 2024, steadily improving since the pandemic peak.
For a landlord, this translates to a very high probability of quickly renting a well-located property, but also a competitive environment where tenants have quality choices, pushing owners to maintain and upgrade their assets.
Choosing your submarket: prime center or profitable periphery?
The 23 wards of Tokyo are divided into several distinct submarkets, often grouped by geographic position (center, east, west, north, south) and socio-economic profile.
The “Central Wards”: financial heart and international showcase
Chiyoda, Chuo, Minato, Shibuya, and Shinjuku form the economic and symbolic core of Tokyo. Here you find the Imperial Palace, major ministries, multinational headquarters, luxury shopping districts, and the most famous entertainment hubs.
In these wards:
Overview of key characteristics of the high-end real estate market in Tokyo’s Minato-ku ward.
Prices are the highest in the city, with new condos easily exceeding 1.5–2M JPY/m².
Gross yields are often between 3% and 4%.
Vacancy is minimal for well-located properties.
The clientele consists of Japanese executives, expats, diplomats, and high-income households (“power couples” earning 15–20M JPY per year).
This territory is particularly suited for wealth preservation strategies and international diversification for high-net-worth individuals: the goal is not to generate high cash flow, but to anchor part of a fortune in a stable and liquid jurisdiction, with a reasonable probability of medium-term capital gains.
Eastern Tokyo: Shitamachi, bay area, and high yields
The wards of Edogawa, Adachi, Katsushika, Koto, Sumida, and Arakawa form a submarket characterized by a tradition of working-class neighborhoods (“shitamachi“) and a rapidly developing bayfront area.
Their combined profile is as follows: Their combined profile is as follows.
– Lower cost of living compared to central wards,
– Reasonable access to major hubs (Tokyo Station, Otemachi, Nihonbashi),
– Good train connections (Akihabara, Ueno, Ayase, Kita-Senju, Nippori, Monzen-Nakacho).
Gross yields above 4.5–5% are not uncommon, with significantly lower prices per square meter than the average for the 23 wards. For a yield-seeking investor, these wards deserve close examination, provided that locations (proximity to stations, building quality, flood or earthquake risks) are carefully selected.
West and northwest: residential suburbs and yield/security balance
Wards like Nerima, Itabashi, Nakano, and Suginami offer a more residential atmosphere, with houses and family condos, parks, schools, and reasonable access to the center. Yields are intermediate (around 4–5% gross), and prices remain affordable compared to Setagaya or Meguro.
These areas are favored for long-term strategies targeting families, with stable demand and lower vacancy risk, at the cost of value growth that is likely less spectacular than in some rapidly gentrifying sectors.
Law, taxation, and financing: what an investor must absolutely incorporate
The strength of the Tokyo market is partly due to the robustness and predictability of its legal and tax framework. But for a foreign investor, the complexity of this framework requires meticulous preparation.
Property rights: maximum openness to foreigners
Japan is an exception in Asia: it imposes virtually no restrictions on foreign ownership. Residents and non-residents alike can freely acquire land and buildings, in full ownership, with no time limit. Rights are identical to those of Japanese citizens, including for transmission (gifts, inheritance).
However, property ownership does not grant an automatic right to a visa or permanent residence, although in an entrepreneurial context, real estate can be linked to “Business Manager” visa schemes for significant capital amounts.
The purchase process: a highly codified mechanism
The acquisition procedure follows well-defined steps: property selection, letter of intent, delivery of the “Explanation of Important Matters” document by the agent, signing the sales contract, depositing the down payment (5–20% of the price), obtaining final financing, signing at the notary (judicial scrivener), and registering the transfer of ownership.
All legal procedures are conducted exclusively in Japanese, with translations having no legal value. For a non-resident, signing a document generally requires a passport and a notarized affidavit. However, it is highly recommended to use a bilingual agency and a legal expert experienced in working with foreign clients to ensure smooth proceedings.
Acquisition costs: budget 5–10% on top of the price
An investor must factor in a “surcharge” of approximately 5–10% of the purchase price to cover:
– agency commission (generally 3% of price + 60,000 JPY + VAT),
– registration and license tax on property transfer,
– real estate acquisition tax (prefecture),
– stamp duty on the contract,
– judicial scrivener fees,
– possible bank processing fees and insurance,
– consumption tax applicable to buildings (10% on the construction portion) and fees.
A typical simulation for a property worth 100M JPY results in about 10% initial down payment, 8% in fees, and 80% financed by loan, subject to bank approval.
Annual taxation: significant but predictable burden
Two main taxes apply annually to ownership:
– Fixed Asset Tax of 1.4% on the taxable value of the property,
– City Planning Tax up to 0.3%, at an effective rate of 0.3% in Tokyo.
For residential land, deductions can reduce the taxable value to as little as one-third of the cadastral value.
Taxation of rents and capital gains
Rents are taxed under property income (or business profits for a company). Non-residents are subject to a withholding tax of around 20% on gross rents, with an obligation to file an annual return to include deductible expenses (management, repairs, loan interest, building depreciation).
Upon resale, capital gains are taxed at rates that depend on the holding period:
– less than 5 years: approximately 39.63%,
– more than 5 years: approximately 20.315%.
Reduced schemes exist for primary residences or certain renovated properties, with deductions of up to 30M JPY on the gain, but these mainly concern residents.
Financing: easier for residents, selective for non-residents
Foreign residents with permanent residency, stable employment, and annual income above 7M JPY can, in practice, access investment loans from major Japanese banks, often up to 80% of the price, for a maximum of 35 years, at rates generally very low by global standards.
This is the loan-to-value (LTV) ratio offered by some banks for mortgages on properties in Tokyo for non-residents.
An increasingly used structure involves creating a Japanese company (GK or KK) to hold the acquisitions. This setup can sometimes allow for corporate financing, optimize certain acquisition taxes (via TMK or GK-TK structures), and facilitate banking relationships. On the downside, it adds a layer of administrative complexity (local representative, filing accounts, tax obligations).
Specific risks of the Tokyo market and ways to mitigate them
Investing in Tokyo is not without risks, even in such a regulated environment.
Bubble risk and yield compression
The UBS Global Real Estate Bubble Index ranks Tokyo among markets at risk of overheating, with prices rising over 30% in five years, much faster than rents. Price-to-income ratios are among the highest in the world. Yields are tightening as prices rise faster than rents, especially in prime neighborhoods.
Many analysts, however, expect a continuation of the rise at a more moderate pace: around 5–6% per year in 2025, compared to a projection of +8% for 2024. About 31% of experts believe Tokyo prices could peak around 2025, compared to 25% a year earlier. The dominant scenario remains a normalization rather than a brutal crash, barring a major macroeconomic shock.
Demographics, aging, and peripheral risk
While central Tokyo continues to attract young professionals and businesses, Japan as a whole faces rapid aging and population decline, leading to an increase in vacant houses in rural areas and some suburbs. In the long run, investing in peripheral sectors heavily dependent on a single source of demand (e.g., a university) carries a non-negligible risk of depreciation.
Authorities offer tax incentives for renovating and reselling akiya. For an investor, it is crucial to target sectors outside the most resilient wards and conduct a thorough study of local demographic projections.
Seismic, climatic, and technical risks
Japan is exposed to earthquakes, typhoons, and flood risks. Buildings constructed before June 1981 (old seismic standards) are considered more vulnerable, and those built before 2000 sometimes have less desirable technical features (foundations, plumbing, insufficient reserve funds, etc.).
To reduce risks, prioritize purchasing buildings constructed after the latest seismic and typhoon standards came into effect. Systematically consult local natural hazard maps. Finally, take out supplementary insurance covering earthquakes and floods, in addition to mandatory fire insurance.
Tenant-friendly rental laws
Japanese laws strongly protect tenants: rent increases are regulated, eviction procedures are complex even in cases of non-payment. Landlords often need to offer incentives (free months of rent, occasional discounts) to attract tenants in a competitive market. Poor tenant selection can quickly erode profitability.
Again, using an experienced management company is key: it handles selection, payment monitoring, dispute management, and mutualizes vacancy risk.
Structural trends: tourism, redevelopment, and sustainability
To think in terms of 10 or 20 years, it is impossible to ignore the major forces reshaping Tokyo.
The tourism boom and short-term rentals
Since the borders reopened at the end of 2022, Japan has recovered and exceeded pre-crisis levels: 37 million foreign visitors in 2024, monthly peaks surpassing 2019, and booming demand for hotels, aparthotels, and minpaku-type rentals.
Tokyo captures a large share of this flow, particularly in neighborhoods like Shinjuku, Shibuya, or Sumida (Skytree, Asakusa). The rise of aparthotels managed by professional operators and the growing power of online platforms are structuring a new submarket. However, observed yields for Tokyo Airbnb properties are often still lower than those for standard rentals once regulatory constraints and operational costs are factored in.
For an investor, the opportunity lies more in hybrid products, managed by specialized operators, rather than a purely speculative unregulated short-term or seasonal rental strategy. This approach offers a more secure and professional framework.
Major urban projects: betting on the future address
Tokyo is in the midst of a mega-redevelopment cycle: Azabudai Hills, Toranomon, Shibuya Sakura Stage, Takanawa Gateway City in Shinagawa, new hubs around Tokyo Station (Yaesu, Nihonbashi, Tokiwabashi), redevelopment of Toyosu, etc. These projects combine offices, housing, retail, hotels, green spaces, and cultural facilities.
Experience from the 2000s (Roppongi Hills, Tokyo Midtown, Shiodome) showed that a successful large project can reshape the hierarchy of land values within a radius of several hundred meters, sometimes with a 15–25% increase in commercial prices.
An investor can anticipate appreciation by targeting neighborhoods with a credible project pipeline. It is crucial to accurately assess the timeline of these projects, often extending to 2030, and to consider the risk of overestimating their impact.
Energy transition and “green” buildings
Starting in April 2025, Tokyo mandates the installation of solar panels on all new single-family homes, as part of its “Carbon Half” plan aiming to halve greenhouse gas emissions by 2030. Simultaneously, stricter energy performance standards are coming into effect for new buildings, and demand from large corporations for certified offices (GRESB, etc.) is exploding.
In the residential sector, demand for energy-efficient, smart, and green-certified homes is increasing. This criterion can become a competitive advantage at resale, especially in a market where the gap is widening between new or renovated buildings and the non-upgraded older stock.
Building your investment strategy in Tokyo
Faced with this complex landscape, the key for an investor is to clarify their objectives and accept the inherent trade-offs.
A “yield”-oriented profile will tend to favor:
– peripheral wards offering 4.5–6% gross (Adachi, Katsushika, Edogawa, Nerima, Itabashi),
– multi-family buildings (especially wooden or concrete structures in the near suburbs),
– compact units (1K, 1LDK) very close to a major station,
– outsourced management at 5–10% of rents, included in the business plan,
– a long holding horizon, with increased sensitivity to interest rate changes.
A “wealth preservation / security”-oriented profile will tend to favor:
– condos in the 5–6 central wards (Minato, Chiyoda, Chuo, Shibuya, Shinjuku, possibly Bunkyo),
– possibly recent or luxury programs in iconic redevelopment projects,
– units suited to expat or executive demand (2LDK–3LDK near hubs),
– moderate financing to limit interest rate risk,
– a vision of value preservation and legacy rather than cash flow.
To optimize your investment, it is advisable to diversify your portfolio by property type, ward, and holding horizon. Relying on local professionals (agency, manager, tax specialist) helps limit risks and blind spots.
In all cases, investing in real estate in Tokyo means accepting less spectacular yields than in some emerging markets, in exchange for a stability/liquidity combination rarely equaled. For an international portfolio already exposed to Europe or North America, Tokyo offers an Asian anchor that is both sophisticated, transparent, and still carrying potential, provided you enter with a rigorous analytical framework, realistic expectations, and solid on-the-ground work.
Disclaimer: The information provided on this website is for informational purposes only and does not constitute financial, legal, or professional advice. We encourage you to consult qualified experts before making any investment, real estate, or expatriation decisions. Although we strive to maintain up-to-date and accurate information, we do not guarantee the completeness, accuracy, or timeliness of the proposed content. As investment and expatriation involve risks, we disclaim any liability for potential losses or damages arising from the use of this site. Your use of this site confirms your acceptance of these terms and your understanding of the associated risks.

Cyril Jarnias is an independent expert in international wealth management with over 20 years of experience. As an expatriate himself, he is dedicated to helping individuals and business leaders build, protect, and pass on their wealth with complete peace of mind.
On his website, cyriljarnias.com, he shares his expertise on international real estate, offshore company formation, and expatriation.
Thanks to his expertise, he offers sound advice to optimize his clients' wealth management. Cyril Jarnias is also recognized for his appearances in many prestigious media outlets such as BFM Business, les Français de l’étranger, Le Figaro, Les Echos, and Mieux vivre votre argent, where he shares his knowledge and know-how in wealth management.