
 Published on and written by Cyril Jarnias
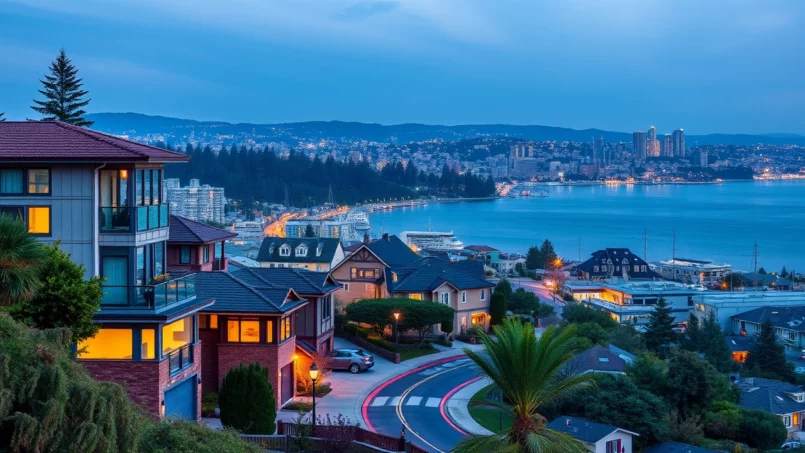
Investing in real estate in Foster City means positioning yourself in a rare market: a small, highly affluent planned city on the edge of San Francisco Bay, wedged between water, Silicon Valley, and strong environmental constraints. Prices are high, competition is real, but the economic stability, quality of life, and demographic fundamentals make it a strategic market for a demanding investor.
This article analyzes the market in detail, covering purchase and rental prices, neighborhood characteristics, ongoing urban projects, potential risks to anticipate, and various investment strategies to consider.
A Very Unique Geographic and Economic Context
Foster City is a completely planned community from the 1960s, built on the former salt marshes of Brewer’s Island, now 81% covered by water. On about 4 square miles of land reclaimed from the bay, the city is almost entirely built out, with canals, lagoons, twelve residential islands, and 13 miles of shoreline.
The location is ideal for an investor, situated halfway between San Francisco and San Jose, at the foot of the San Mateo Bridge, and immediately adjacent to major employment hubs like San Mateo, Redwood City, and Burlingame. It attracts large international companies such as Visa International, Gilead Sciences, Sony Interactive Entertainment, Guidewire Software, and the publisher of the ‘For Dummies’ series, which have established their headquarters or large campuses here.
With a median household income of about $152,000 to nearly $194,000 per year, a per capita income around $68,000, an unemployment rate of 3.5%, and a poverty rate of 3.6%, Foster City is home to a highly creditworthy population, mostly college-educated and largely employed in skilled professions (over 94% white-collar jobs). The city has been ranked among the best places to live in the United States by Money Magazine.
For an investor, these economic indicators translate into high purchasing power, solid rental demand, low sensitivity to moderate economic cycles… but also very high entry prices.
An Expensive but Structurally Tight Residential Market
The real estate market in Foster City is clearly a seller’s market. Various sources converge on the same observation: supply is limited, properties sell quickly, often above the asking price.
In terms of price levels, the citywide orders of magnitude are as follows:
| Indicator (Entire City) | Approximate Value* |
|---|---|
| Average home value (recent source) | ~$1,931,800 |
| Typical value (other source) | ~$1,788,500 |
| Median sale price (all types, recent month) | $1.4M to $1.625M |
| Median single-family home price (recent) | ~$2.0 to $2.2M |
| Average single-family home price | ~$2.1 to $2.3M |
| Median price per square foot (approximate, converted) | $905 to $930/sq ft |
| Range of listing prices | $628,000 to $2.9M |
| Typical range for single-family homes | $1.7M to $3.3M |
Figures come from multiple sources and periods between 2022 and late 2025, hence slight variations.
This is the maximum annual percentage increase that prices reached at their peak.
Most striking is the sales dynamics:
| Market Dynamics | Indication |
|---|---|
| Average days on market (city, recent period) | 20 to 24 days |
| Median days on market (homes, Q4 2025) | 12 days |
| Average days on market (homes, Q4 2025) | 16 days |
| Offers received per property (average) | ~3 offers |
| Percentage of sales above list price | 70 to 81% depending on period |
| Sale-to-list price ratio | 102.6% to 114.3% (peaks), 106% Q4 2025 |
| Number of sales Q4 2025 (homes) | 11 (about half of a typical quarter) |
The hottest properties can go under contract in one to two weeks, sometimes with multiple offers and bidding wars of 4 to over 10% above the asking price, depending on the neighborhood.
For an investor, this means you need to be extremely prepared: locked-in financing, clear strategy, responsiveness, and a good micro-local knowledge to avoid price mistakes in an environment where negotiation room is slim.
A Diverse But Nearly Non-Expandable Housing Stock
Foster City has approximately 12,800 housing units, a fairly balanced mix of single-family homes and multi-family buildings.
| Type of Housing | Approximate Share of Stock |
|---|---|
| Large complexes / multi-family buildings | ~38 to 40% |
| Detached single-family homes | ~35% |
| Row houses / attached homes | ~18 to 19% |
| Duplexes / small multi-family | ~8% |
A significant portion of the building stock dates from the 1970s to 1990s, with about a quarter of homes built before 1970, and just under 12% after 2000. Since the land is almost entirely used, the potential for expansion mainly comes from densification, renovation, or targeted redevelopment (e.g., research campus projects, building reconstruction, or residential complexes like Lantern Cove).
For an investor, a homogenous aging housing stock—like 1970s condos and homes along the lagoon—presents recurring maintenance needs but also clear value-add opportunities through modernization work.
A Rental Market Among the Most Expensive in the United States
For an investor focused on rental yield, Foster City stands out with rents significantly above national and even California averages. According to various sources, average and median rents converge on a broad range, but always very high.
| Overall Rental Indicator | Approximate Value |
|---|---|
| Average monthly rent (all properties, 2025) | ~$3,800 |
| Alternative average rent (apartments) | ~$3,445 to $3,593 |
| Median rent (all properties) | ~$3,508 to $3,691 |
| Official median rent (another source) | ~$3,695 |
| Average rent (January 2026) | $3,106 |
| General range of rents | $2,000 to $12,000 (sometimes $1,200 to >$10,000) |
| Gross median rent (statistics) | ~$3,002 |
Rents are reportedly approximately 90-91% higher than the national average, and up to 248% higher than the national average for apartments in some cost-of-living indices.
By property type, rents sit at levels that clearly target very affluent households:
| Property Type (Apartment) | Average Monthly Rent (Order of Magnitude) |
|---|---|
| Studio | ~$2,500 to $2,995 |
| 1 bedroom | ~$3,100 to $3,200 |
| 2 bedrooms | ~$3,800 to $4,000 |
| 3 bedrooms | ~$5,200 to $5,500 |
An important takeaway for an investor: the “30% of income” rule implies that an average tenant needs about $124,000 in annual income to afford the average rent, which aligns well with local income levels. This is a positive sign of sustainable demand, but it restricts the rental market to a very specific socio-economic profile.
Homeowner / Renter Split
The city has a near 50/50 split between owners and renters, which is quite rare at these price levels.
| Housing Tenure | Share of Households |
|---|---|
| Homeowners | ~51% |
| Renters | ~49% |
This high proportion of renters, combined with significant incomes and a dynamic job market, forms a robust foundation for rental investment, whether in apartments, houses, or high-end lagoon-front properties.
Neighborhoods with Very Different Profiles: Where to Invest?
Foster City is divided into about ten neighborhoods with distinct positions in terms of price, lifestyle, and investment potential.
Bay Vista: High-End, Bay-Facing
Bay Vista is generally identified as the most expensive neighborhood in Foster City, with a median listing price around $2M and a price per square foot close to $1,000. The homes, often facing the bay, offer views, quick access to parks, and a highly sought-after environment.
For an investor, Bay Vista is typically a segment for capital appreciation and wealth preservation: modest rental yield but strong long-term value potential, especially given the scarcity of land with direct bay views.
Marina Point: The Relative “Deal” of the Market
Conversely, Marina Point (nicknamed “The Ships”) is identified as the most affordable neighborhood, despite a very attractive waterfront setting. It offers a mix of houses, townhomes, and condos.
| Marina Point (Key Indicators) | Value |
|---|---|
| Median listing price | ~$844,000 to $849,800 |
| Median sale price | ~$895,000 |
| Median price per square foot | ~$695 to $699/sq ft |
| Market type | Seller’s market |
| Average days on market | ~44 days |
| Sale-to-list price difference | +1.87% |
For the investor, Marina Point can be a more accessible entry point into the city, with tickets under a million dollars in some cases, while still being in a sought-after environment close to lagoons and parks.
Treasure Isle: City Center and Balanced Supply/Demand
Treasure Isle holds a central position, with several residential islands offering direct water access. The neighborhood combines housing, retail, and employment.
| Treasure Isle (Key Indicators) | Value |
|---|---|
| Median listing price | ~$1.48M |
| Median sale price | ~$1.6M |
| Median price per square foot | ~$873/sq ft |
| Market type | Balanced market |
| Average days on market | ~26 days |
This neighborhood illustrates an intermediate segment: high but not extreme prices, a less overheated market than some other areas, which may leave a bit more negotiating room while offering solid rental potential, especially for families or professionals seeking proximity to services.
The Islands: Iconic Architecture and Strong Tension
The Islands is an iconic neighborhood, awarded by “Architectural Record” magazine in the 1970s for its island urban planning. It mainly features townhouses and condos, as well as homes with private docks along Central Lake.
| The Islands (Key Indicators) | Value |
|---|---|
| Median listing price | ~$1.4M |
| Median price per square foot | ~$956/sq ft |
| Typical waterfront home price | ~$2M |
| Condo/townhome prices (Winston Square) | ~$1.5 to $1.9M |
| Sale-to-list price difference | +11.38% |
| Average days on market | ~28 days |
The average premium of over 11% above the listing price shows the competitive intensity. For an investor, The Islands is a highly desirable niche market: ideal for a long-term capital appreciation profile, including upscale furnished rentals targeting senior executives or international families.
Other Micro-Markets to Watch
Other neighborhoods or sub-areas deserve an investor’s attention:
Overview of the main residential neighborhoods and their distinct real estate characteristics.
Spacious homes with water views. Average value around $2.65M (range $2.1 to $3.5M).
Family neighborhoods with significant sales volumes (up to 16 sales per year for Carmel Village).
Mixed-use zone (residential/employment) with development projects. Rental opportunities for employees of nearby campuses.
Lagoon-front properties with private docks. High appeal for water sports enthusiasts.
For an investor, the most relevant approach is to segment your strategy by neighborhood, based on the target profile (families, tech executives, seniors, affluent renters, high-end coliving, etc.) and your holding horizon.
Zip Codes and Regional Comparison: Foster City’s Positioning
Foster City is primarily associated with zip codes 94404 and, in some data breakdowns, 94405. Compared to neighboring areas, it sits in the upper tier, though not reaching the peaks of ultra-premium cities like Burlingame or Hillsborough.
| Zip Code (Nearby Area) | Median Home Price | Price per Square Foot |
|---|---|---|
| 94404 (includes Foster City) | ~$1,369,000 to $1.64M | ~$890/sq ft |
| 94403 (San Mateo) | $1,880,000 | $1,008/sq ft |
| 94402 (San Mateo) | $2,475,000 | $1,148/sq ft |
| 94010 (Burlingame) | $3,950,000 | $1,301/sq ft |
| 94070 (San Carlos) | $2,195,000 | $1,111/sq ft |
| 94002 (Belmont) | $1,988,000 | $978/sq ft |
For rents, zip code 94404 shows a median rent around $3,872 per month, significantly higher than many California areas but sometimes lower than ultra-premium cities or the most expensive pockets of the Bay Area.
To assess Foster City’s competitiveness, an investor can compare its real estate market to neighboring cities. For instance, acquisition costs are high, but they remain lower than in Burlingame or certain parts of Palo Alto. This relative price advantage must be weighed against Foster City’s major assets, such as quality of life and school system performance, which make it very attractive.
Rental Yield: Between Scarcity and Entry Price
Given purchase prices and rents, the price-to-rent ratio in Foster City is high. For zip code 94404, a ratio around 39 is mentioned: this means it would theoretically take about 39 years of gross rents to recoup the purchase price, typical of markets with strong capital appreciation but modest current yields.
Nevertheless, the median gross monthly rent around $3,000 to $3,700 and rents that can reach $5,000 to $12,000 for high-end homes allow some investors to achieve acceptable cash flow, especially with a substantial down payment and optimized financing.
For a simplified example: a home purchased for $2.2M and rented for $7,000 per month (figures consistent with some estimates for large 5-bedroom homes) would yield about $84,000 in annual gross rent, less than 4% gross yield before expenses, taxes, maintenance, and financing. This is clearly a “prime” logic: capital preservation, benefiting from long-term appreciation and low vacancy risk, rather than a purely opportunistic cash-flow strategy.
The Weight of Property Taxes: A Must in the Business Plan
In California, and especially in the San Francisco Bay Area, property taxes weigh heavily on profitability. In Foster City, the effective tax rate is around 1.15 to 1.20% of assessed value, slightly below the San Mateo County average but above the national median.
| Tax Indicator (94404 / Foster City) | Approximate Value |
|---|---|
| Average effective rate | ~1.15 to 1.20% |
| Median annual property tax | ~$9,050 to $9,871 |
| National median bill (comparison) | ~$2,400 |
| Range (10th – 90th percentile) | ~$2,987 to $21,027 |
The California system (Proposition 13) theoretically caps the base tax at 1% of assessed value, with an annual increase limited to 2%, but voter-approved additions add layers. Furthermore, the assessed value remains tied to the purchase price: an investor entering today at $2.2M will structurally pay more than a long-term owner who bought 20 years ago.
In a rental business plan for Foster City, property tax must be incorporated as a primary expense, on par with HOA fees, landlord insurance, maintenance reserves, and management fees—not as a secondary adjustment variable.
The Environmental Dimension: The Reality of Sea Level Rise Risk
A major factor sets Foster City apart from other expensive markets: its potential vulnerability to flooding and sea level rise. Built on fill just above bay level, the city depends on a levee system for protection.
Amount in millions of dollars of the bond measure approved by nearly 81% of residents to fund levee raising.
Work completed in 2023‑2024 raised and modernized approximately 6.5 to 8 miles (10 to 13 km) of levee, with three types of structures (earthen embankment, sheet pile curtain, concrete walls). Over 22,000 feet of sheet piles and 4,000 feet of walls were installed, and the levee is now on average 6 feet higher than before, designed to incorporate medium-term sea level rise scenarios.
The city protected property values by avoiding a wholesale reclassification as a high-risk zone. However, projections of sea level rise (1.1 to over 3.5 feet by 2100, and more in extreme scenarios) and subsidence of some fill land remain factors to monitor for very long-term investment horizons.
It is therefore prudent to factor in climate risks (flooding, liquefaction, groundwater level) in the analysis of each property, especially for those closest to the bay or canals.
Urban Projects, Infrastructure, and Planning: A Long-Term Signal
Beyond the levees, Foster City is rolling out an impressive series of infrastructure projects, mobility enhancements, parks, and public facilities: pump station upgrades, water system improvements, community center renovations, park master plan, bike and pedestrian plan, wastewater treatment plant upgrades, road network rehabilitation, etc.
Several private projects also boost economic attractiveness:
Key initiatives by Gilead Sciences to expand and modernize its research infrastructure and workspaces.
Major campus expansion of up to 800,000 square feet of research & development space.
Transformation of former office space, such as at Vintage Park, into specialized life sciences buildings.
Project for an open space on E. Hillsdale Blvd, incorporating dining and retail to complement existing offices.
At the same time, the city updated its Housing Element 2023‑2031, a state-mandated strategic document that plans housing production for all income levels and integrates climate resilience and habitat protection imperatives. It is also developing objective design standards for single-family homes and ADUs (accessory dwelling units) to clarify and expedite permitting procedures while ensuring architectural consistency.
For the investor, these dynamics reflect proactive governance, which strengthens the long-term value of the area by securing critical infrastructure and anticipating housing and mobility needs.
Investment Strategies Suited to Foster City
Several classic real estate investment strategies can be considered in Foster City, each with its nuances in this particular context.
Buy & Hold / Long-Term Acquisition
This is the most natural strategy in Foster City: buy a property (house, townhome, condo) to hold long-term, betting on a combination of gradual appreciation and robust rents.
Favorable factors:
– Positive population growth over the decade (+13.5% approx.).
– Very high median income, diversified employment, low unemployment.
– Sustained rental demand, especially due to highly rated schools and proximity to Silicon Valley.
– Nearly fixed land supply, limiting overbuilding risks.
Constraints:
– Gross yields often modest given acquisition prices.
– High property taxes.
– Higher maintenance costs for lagoon-front homes or those exposed to high water levels.
This strategy suits a wealth investor or a household looking, for example, to buy a first rental foothold in the Bay Area with the idea of moving in later.
BRRRR, Renovation and Value-Add
The BRRRR model (Buy, Rehab, Rent, Refinance, Repeat) is trickier to deploy in Foster City due to a lack of deeply discounted properties. However, the 1970s-80s housing stock offers modernization opportunities:
An energy efficiency upgrade, combined with a complete interior modernization, can add value to a property. This includes bringing it up to current standards with an open kitchen, master suites, and home office spaces. Depending on local regulations, integrating secondary units (ADUs) on certain lots may also be considered to optimize space usage.
Renovation costs are high, but potential rents are equally high. The key is to control the budget for work and permit timelines, hence the benefit of working with local contractors and architects who know the city’s requirements thoroughly.
High-End Long-Term Rentals
Given rents that can exceed $4,500 for a three-bedroom house and $5,000 or more for a three-bedroom waterfront property, high-end long-term rentals are a serious avenue. Targets include:
Foster City attracts a diverse population seeking an exceptional, safe, and well-connected living environment near the Bay Area’s economic hubs.
Attracted by renowned schools like Foster City Elementary, Brewer Island, Beach Park Elementary, or Audubon. They value the quality of the education system and the family-friendly environment.
Willing to pay a premium for the lagoon setting, abundant parks, and reasonable commutes to Silicon Valley and Peninsula campuses.
Seeking a safe, well-maintained environment with plenty of recreational activities and a dynamic community.
To maximize occupancy and justify a high rent, a high-end positioning (finishes, furnishings, services) is often relevant.
Short-Term Rentals and High-End Furnished Rentals
Platforms like Airbnb or VRBO are explicitly cited as possible vehicles for short-term rental investment. In Foster City, this strategy can target:
– Consultants, executives on long-term assignments in the region,
– Families in housing transitions,
– Long-stay visitors to Silicon Valley campuses or research centers.
It is crucial to check current local regulations on short-term rentals, which may impose minimum stays, caps, or registration requirements, and are subject to change. While demand exists, the market is primarily residential; a business model targeting almost exclusively tourism would be riskier here than in San Francisco.
Fix & Flip
Fix & Flip – buying, quickly renovating, and reselling – can work occasionally, but the speed of sales, already very high prices, and buyer expectations reduce potential margins. Parameters to watch closely:
– Average cost of structural renovations in a city with waterproofing and foundation issues,
– Average days on market for the target segment (property type, neighborhood),
– Historical spread between listing price and sale price for similar renovated properties.
This strategy is better suited to very experienced operators on the local market than to a beginning investor.
More Financial Strategies: Mortgage Notes, Wholesaling, etc.
In such an expensive market, certain “paper” strategies (creating or acquiring mortgage notes, partnering with cash buyers, wholesaling activities) also have their place. However, they require a fine understanding of California foreclosure law, a good read on default risk (low but not zero, even in an affluent city), and strong local networks.
The Central Role of Schools and Quality of Life
A large part of the purchase and rental demand in Foster City is driven by school quality and the living environment. The San Mateo–Foster City district for elementary and middle school, and the San Mateo Union district for high school, offer several well-rated schools.
Among the highlighted elementary schools:
| Elementary School | Index / Score (Order of Magnitude) | Main Strengths |
|---|---|---|
| Foster City Elementary | High score (≈ 8/10 or 88/100) | Strong math proficiency |
| Brewer Island Elementary | High score | Good math scores |
| Beach Park Elementary | High score | Good student-teacher ratio |
| Audubon Elementary | Good score | Solid reading performance |
In addition, there are Bowditch Middle School for middle school, well-regarded high schools like Hillsdale or San Mateo High, and several private schools and preschools.
For an investor, proximity to these schools and to iconic parks like Leo J. Ryan Memorial Park, Bay Trail paths, sports facilities, or cultural centers (Hillbarn Theatre, galleries) has a direct impact on:
– Resale liquidity,
– The achievable rent level,
– Tenant stability (families staying for several years).
Cost of Living and Tenant/Buyer Profile
The cost of living in Foster City is about 174% higher than the U.S. average, with housing over 600% more expensive than the national median. Fuel, utilities, healthcare, and groceries are also above American standards.
Households living in this type of property are generally well above the national average in income and education level. For the investor, this profile reduces the risk of rental vacancy and non-payment. On the other hand, it makes any investment strategy focused on the “affordable” market segment particularly difficult to implement on the open market.
However, there is a significant stock of below-market-rate (BMR) housing and subsidized programs managed by operators like MidPen Housing or BRIDGE Housing, as well as city-owned properties (e.g., at Marlin Cove, Alma Point in Foster Square, Metro Center Senior Homes). These programs serve a public policy goal of affordability but generally fall outside the scope of a typical private investor, except through specific structures.
Risks and Points of Vigilance for the Investor
Investing in real estate in Foster City is not just about buying an expensive property in a good city. Several risks and constraints must be anticipated:
Investing in lagoon-front properties, despite structural demand in the premium market, is subject to several significant risks. These include long-term environmental risks (sea level rise, subsidence), price volatility in the high-end segment, high taxes and maintenance costs that reduce net yield, evolving regulations (building codes, rental rules), and competition from other Bay Area markets that may offer more favorable price-to-rent ratios.
A savvy investor will incorporate these elements into their scenario, regularly updating their assumptions (values, rents, expenses, taxes) and closely following the city’s and county’s urban planning documents.
Conclusion: A Market of Conviction, Not Quick Speculation
Investing in real estate in Foster City means accepting a high entry ticket to access a very particular micro-market: a planned, very safe, very wealthy city surrounded by water, underpinned by Silicon Valley jobs, and equipped with modernized infrastructure to face climate challenges.
The local real estate market is structurally tight, with fast sales, often surpassed prices, high rents, and strong residential immigration. Given this dynamic, the most consistent investments are long-term: a buy & hold wealth strategy, sustainable quality rentals, or value-add through targeted renovation.
For the investor seeking high cash flow in the short term or aggressive “flip” strategies, other Bay Area markets, less expensive and more voluminous, will likely be more suitable. However, for those looking to anchor part of their wealth in a rare city, globally well-managed, with high quality of life and strong economic appeal, Foster City remains a premier real estate destination—provided its risks and costs are mastered.
Disclaimer: The information provided on this website is for informational purposes only and does not constitute financial, legal, or professional advice. We encourage you to consult qualified experts before making any investment, real estate, or expatriation decisions. Although we strive to maintain up-to-date and accurate information, we do not guarantee the completeness, accuracy, or timeliness of the proposed content. As investment and expatriation involve risks, we disclaim any liability for potential losses or damages arising from the use of this site. Your use of this site confirms your acceptance of these terms and your understanding of the associated risks.

Cyril Jarnias is an independent expert in international wealth management with over 20 years of experience. As an expatriate himself, he is dedicated to helping individuals and business leaders build, protect, and pass on their wealth with complete peace of mind.
On his website, cyriljarnias.com, he shares his expertise on international real estate, offshore company formation, and expatriation.
Thanks to his expertise, he offers sound advice to optimize his clients' wealth management. Cyril Jarnias is also recognized for his appearances in many prestigious media outlets such as BFM Business, les Français de l’étranger, Le Figaro, Les Echos, and Mieux vivre votre argent, where he shares his knowledge and know-how in wealth management.





