
 Published on and written by Cyril Jarnias
wp:paragraph –>
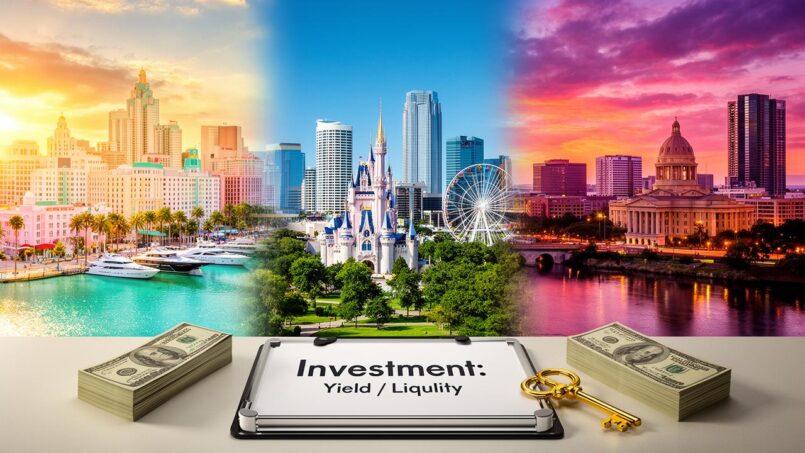
Choosing between Miami, Orlando, or Austin is no longer just a matter of personal preference for sun or theme parks. For an investor, the real question is: where can you find the best trade-off between rental yield and market liquidity, without getting caught out by cyclical effects or unfavorable regulations?
Miami offers appreciation potential and attracts international capital. Orlando stands out with high gross yields on short-term rentals. Austin, after a sharp correction, is normalizing as a tech hub. Each city presents nuanced realities behind these distinct advantages.
The goal here is not to crown an absolute “winner”, but to understand in which city your investor profile – focused on cash flow, capital appreciation, liquidity, or a mix of the three – will be best served.
Understanding the yield/liquidity pair before comparing cities
Before diving into the city-by-city details, two concepts underpin every investment:
Yield, first, typically measured by the capitalization rate (cap rate) or gross yield: annual rents divided by the purchase price. But this figure, flattering on paper, must be adjusted for actual expenses (taxes, insurance, maintenance, vacancy, management, HOA fees, etc.) to approximate net yield.
Real estate liquidity goes beyond the speed of sale. It includes market depth (number of solvent buyers, share of cash purchases, appetite from professional investors), ease of renting quickly, and the ability to reposition a property (sale, long-term or seasonal rental) if the strategy changes.
In a U.S. environment where rates have stabilized in the 6–7% range, cap rates are readjusting, and local cycles are very pronounced, arbitrating between instant yield and future liquidity becomes the name of the game.
Miami: the capital machine… not always serving cash flow
Miami has become the archetype of an “appreciation play” market: you buy there primarily for value creation, secondarily for rental income. The 2025–2026 figures confirm this.
The median home price in the metropolitan area exceeds $580,000, with a price per square foot around $518/sqft in the city, and a median single-family home near $700,000 in Miami-Dade County. Rents follow suit, with an average rent of about $3,000 per month, well above the national average (around $1,930).
Yield: decent on paper, eroded by expenses
In theory, Miami is not a “low-yield” city. Several analyses put the gross yield around 5–7% on average, with significant differences depending on the neighborhood.
A table helps visualize the gap between the wealthiest and the more popular segments:
| Segment / Zone | Approximate Average Price | Typical Gross Yield | Profile |
|---|---|---|---|
| Overall Miami Market | ~$580,000 | ~5.2–5.6% | Residential mix |
| Premium neighborhoods (Brickell, Miami Beach, Coral Gables) | $600,000 – $3M+ | 3–5% (often lower on ultra-luxury) | Capital appreciation / capital preservation |
| Emerging neighborhoods (Little Havana, Allapattah, Edgewater off the waterfront) | Below the median | 7–9% gross, sometimes 8–10% on small multifamily | More aggressive cash flow |
In practice, the European or French investor often ends up with a net yield between 3.5% and 5.5% on a well-structured property, and sometimes barely 2% on certain luxury condos heavily burdened by HOA fees and insurance.
Insurance premiums are dropping by an average of about 14% in Miami-Dade in 2026.
An appreciation market… that delivers on its promises
Where Miami clearly stands out from its competitors is value appreciation, particularly in the pre-construction and luxury segments.
In the high-end new condo niche alone, annual growth reaches 12 to 18% in the upper range, driven by a massive influx of foreign buyers. Properties above $2M even see gains of 20 to 25% between the reservation contract and the market value at delivery.
A summary table of prices per square foot and annual appreciation illustrates this dynamic:
| Neighborhood (luxury pre-construction) | Price per sqft (range) | Estimated Annual Appreciation |
|---|---|---|
| Brickell | $1,200 – $1,500/sqft | +14 to +18% |
| Miami Beach | $1,100 – $1,600/sqft | +8 to +13% |
| Sunny Isles Beach | $900 – $1,400/sqft | +10 to +15% |
| Edgewater | $800 – $1,100/sqft | +12 to +16% |
| Downtown Miami | $700 – $950/sqft | +10 to +14% |
The pre-construction model further amplifies this capital logic: the investor typically puts down 30 to 50% in deposits spread over the construction period, pays no interest, no expenses, and no taxes for two to three years, and at delivery cashes in a potential capital gain of 15 to 20%. Relative to the capital actually tied up (the deposit), the deal can yield around 18% annualized with no intermediate cash flow.
Liquidity: abundant buyers, deep but segmented market
In terms of liquidity, Miami checks many positive boxes. Sales above $1M are up more than 20% over 12 months, nearly a third of transactions are cash, and the luxury condo market attracts international clientele that is hard to shake by local employment cycles or rates.
Multifamily vacancy at 6.6%, below the national average, rents stable or slightly rising, and structural demand supported by tourism, migration, and the absence of state income tax.
The downside is a highly polarized market:
– Premium neighborhoods (Brickell, Miami Beach, Coconut Grove, Coral Gables, Key Biscayne) are very liquid but relatively low-yield on cash flow,
– Emerging neighborhoods (Little Havana, Allapattah, parts of Edgewater or downtown) offer higher gross yields but can be more volatile, with heavier operational management.
Short-term rental regulations: a hidden drag on yield
Another factor to consider: local short-term rental regulations. Florida is overall the most Airbnb-rich state in the U.S., with a fairly clear state framework, but counties and cities retain broad authority.
In Miami Beach, rentals under six months are banned in most residential areas, except in designated hotel or commercial zones. Seasonal operation there thus becomes an expert game, with licenses, zoning, and risk of hefty fines.
In other Miami-Dade municipalities, obligations (registration, tourist tax, density rules) are strict. For an investor targeting yield via Airbnb, it is necessary to target buildings and micro-neighborhoods explicitly compatible and accept a higher legal and operational cost.
Summary: who is Miami for?
Miami primarily suits the investor who:
– prioritizes capital appreciation over 5 to 10 years over monthly cash flow,
– accepts a net yield often between 3.5% and 5% over the long term,
– has sufficient financial capacity to support high down payments (pre-construction, luxury, waterfront),
– seeks strong resale liquidity, particularly in segments sought by international buyers.
For a pure rental yield hunter, Miami remains possible – via emerging neighborhoods or multifamily – but Orlando or certain secondary Florida cities offer more obvious cash-flow profiles.
Orlando: the cash-flow factory (if you know where to step)
Orlando is the world capital of theme parks, but for investors, it is above all the American epicenter of short-term rentals. With over 75 million annual visitors, tourist demand supports an ecosystem of villas and condos dedicated to Disney and Universal, offering gross yields hard to find in major metros.
Very high gross yields on seasonal rentals
Multiple datasets converge: on short-term rentals, Orlando can show cap rates in a range of 6 to over 10%, with annual cash-on-cash returns regularly exceeding 10% for the best assets.
In the Disney–Universal corridor, the numbers are impressive. Villas with 5 to 8 bedrooms and a pool in flagship resorts often achieve gross revenues between $50,000 and over $100,000 per year, with occupancy rates of 70 to 85% in high performance. In practice, the operating margin (NOI) often represents 60 to 70% of revenue after management fees, cleaning, HOA costs, etc.
A simplified table of cap rates by zone illustrates the potential:
| Orlando Zone / Tourist Corridor | Typical Nightly Rate | Average Occupancy | Estimated Gross Yield (cap rate) |
|---|---|---|---|
| Immediate vicinity of Disney (3 miles) | $200–280/night | 78–85% | 7.5–10.5% |
| Near Universal (Kirkman area) | $180–250/night | 75–82% | 7–9.5% |
| International Drive / Sand Lake | $160–220/night | 72–80% | 6.5–9% |
| Kissimmee / US-192 | $140–200/night | 70–80% | 6–8.5% |
| Downtown Orlando (urban short stay) | $130–180/night | 65–75% | 5.5–8% |
These cap rates are calculated assuming around 40% operating expenses. An owner who self-manages and reduces management fees can squeeze out 2 to 3 additional yield points.
Across the entire Orlando Airbnb market, the median annual revenue is around $38,000 for the 2025–2026 period, with an occupancy rate of about 67% and an ADR (average daily rate) of around $147 across all property types. Unsurprisingly, 5-bedroom villas constitute the “sweet spot” for investors: they generate a median of nearly $28,000 in revenue, with the top 10% exceeding $60,000.
A long-term rental market normalizing
In parallel, Orlando’s conventional residential rental market has gone through a cycle of oversupply followed by a gradual return to balance. After a vacancy peak around 11% in late 2024 for apartments, the rate is falling back to around 9.5–10% in early 2026. The decline in annual rents, which exceeded –3% in 2024, has nearly dissipated, with rents now nearly stable, or even slightly rising in certain submarkets like Lake Nona or large family homes.
In Orlando, the median rent is between $1,640 and $1,700 per month, representing about 29% of the median annual income of $69,000. This affordability pressure curbs rent growth in the short term but supports strong rental demand given the inability to buy.
Liquidity: longer time to sell, but strong rental depth
On the sales side, Orlando is not as liquid as Austin or Miami in the pure residential segment. Some indicators report median days on market that can exceed 200 days for certain segments, even if other readings place the city in a “neutral market” zone, with about 4 to 5 months of inventory.
Rental liquidity is very high in good tourist locations, especially in the Disney–Universal corridor, where turnover is fast and the best Airbnb properties show occupancy rates above 70%. However, competition is intensifying: the number of short-term listings has doubled in three years in some segments, and median monthly revenues are highly dispersed between the top 10% and the poorly optimized lower end.
The best Airbnb properties in the Disney–Universal corridor show occupancy rates above 70%.
The number of active short-term listings has doubled in three years in some segments, intensifying competition.
Median monthly revenues are highly dispersed between the top 10% and the poorly optimized lower end.
In detail, the hierarchy by short-term rental zones is instructive:
| STR Submarket (Airbnb / vacation rental) | Median Monthly Revenue | Approximate ADR | Average Occupancy |
|---|---|---|---|
| Kissimmee | ~$3,539/month | ~$250/night | > 60% |
| Davenport | ~$3,047/month | ~$228/night | > 60% |
| Orlando “proper” | ~$2,772/month | ~$202/night | ~64.5% |
| Winter Park | ~$2,298/month | ~$168/night | ~71% |
We can see that some submarkets offer excellent occupancy rates (Winter Park) with a more modest rate, while the Disney corridor maximizes the average basket.
Regulations and costs: Florida-friendly, but not “no rules”
On the regulatory front, Orlando falls into the “STR-friendly” category. Florida requires a tourist lodging license (DBPR) for any rental under 30 days repeated several times a year, in addition to the tourist tax and local VAT. The city of Orlando adds specific permits (home sharing, commercial dwelling unit), with compliance requirements (zoning, safety, maximum occupancy).
Compared to Miami Beach or certain coastal towns, the framework remains relatively favorable. The spectacular insurance hikes that shook Florida in 2022–2023 are now stabilizing: competition among insurers is returning, and pressure on premiums is slowing.
The sticking point is management: to capture double-digit net yields, you either delegate to specialized short-term rental managers (typically 20% commission) or get very actively involved, with a quasi-hotel logic (heavy theming, quick response to reviews, dynamic pricing optimization). Figures show that properties truly “themed” around the parks achieve occupancy rates 15 to 20% higher than identical but plain homes in the same resort.
2026 trend: the supply wave recedes, structural demand holds
After a cycle of overbuilding, particularly in multifamily, starts are falling. The pipeline of new apartments is decreasing noticeably, and overall rental vacancy is expected to stabilize around 8.9% through the end of 2026, with slight rent growth (about +1.2%). Institutional investors are selectively returning to apartments and commercial (retail), even if Orlando should remain below the regional average in terms of rent growth in the short term.
For STRs, the opening of Epic Universe has already generated about a 12% increase in tourist rental demand, with an “overheating” effect in some micro-zones. The ability of individual investors to maintain high occupancy rates and sustained ADRs will depend on the market’s capacity to absorb this additional supply.
STR Analysis
Summary: who is Orlando for?
Orlando is particularly suited to the investor who:
– seeks a cash-flow strategy via short-term rentals, with gross yields of 8 to 10% (or more for the best assets),
– is willing to accept more intensive management (or high management fees),
– prioritizes very specific areas (Kissimmee, Davenport, near the parks, International Drive) over conventional urban residential,
– tolerates slower resale liquidity than in a major metro but relies on excellent rental liquidity as long as tourism remains robust.
For a more passive investor focused on long-term rentals, the city remains interesting, but the yield gap with Austin or certain Texas cities narrows, especially considering the cyclical volatility of rents and high sensitivity to tourism cycles.
Austin: tech in correction, opportunity or false good deal?
Austin is the most complex case of the three. Between 2020 and 2022, the Texas capital went from “hottest market in the US” to champion of the Sun Belt correction. Prices have fallen by about 15 to 25% from the 2022 peaks depending on the index and period, before stabilizing and even edging slightly upward in some segments.
In 2026, we are no longer in a crash, but in an advanced normalization phase.
Corrected prices, more accessible entry-level… but meager cash flow
On the price side, several indicators illustrate this correction. The median home price is around $415,000 to $485,000 depending on the source and scope (city vs metro area), which remains above 2019 levels but well below the 2022 peak (around $550,000). For investment properties, the median single-family home price is around $399,000.
This decline of 15 to 24% creates a “safety margin” that did not exist at the height of the bubble. Yet short-term cash flow remains low, or even negative, due to three major factors: still-high price levels, rents under pressure from abundant housing supply, and especially very heavy property taxes (about 2.1–2.4% of value per year, or $10,500 to $12,000 per year on a property worth $500,000).
Typical deal analyses are telling: with standard financing on a leveraged Austin home, the effective cap rate on a long-term rental is around 0.4%, compared to over 4% in a secondary Texas city like Temple. In some scenarios, monthly cash flow is frankly negative (over –$1,800/month in one case compared to Temple at –$343/month). Even more general studies grant Austin cap rates on the order of 2.4–3.2% on average across the entire residential market, while Orlando or Miami often show gross yields above 5%.
A comparative table illustrates the pure yield differential between a few cities studied nationally:
| City (residential rental, 20% down, rate ~6.85%) | Typical Price | Typical Monthly Rent | Estimated Cap Rate | Approximate Monthly Cash Flow |
|---|---|---|---|---|
| Cleveland | ~$235,000 | ~$1,692 | ~4.3% | –$384/month |
| Indianapolis | ~$278,500 | ~$1,918 | ~4.4% | –$430/month |
| Atlanta | ~$361,900 | ~$2,221 | ~4.0% | –$704/month |
| Phoenix | ~$425,500 | ~$2,296 | ~3.4% | –$1,041/month |
| Austin | ~$408,000 | ~$2,273 | ~2.4% | –$1,321/month |
We immediately see that Austin sits at the bottom of the table in terms of current yield, which explains why it is sometimes poorly rated for “beginners” seeking cash flow, despite its aura as an attractive tech hub.
Total return rather than cash flow: the logic of Austin investors
Why, then, do some investors continue to buy in Austin? Because they think in terms of “total return” and not immediate income.
Even with slightly negative cash flow, the combination of three components can remain favorable:
– principal amortization (loan paydown) building equity each month, around $3,900 in the first year on a property worth about $335,000,
– tax savings from depreciation: for a building value of $265,000 (on a price of $335,000), the annual deduction of about $9,600 can generate over $3,000 in tax savings for a household in the 32% bracket,
– long-term appreciation: even a conservative scenario of +3% per year on $335,000 adds over $10,000 in value per year.
In one numeric example, a property that loses about $13,800 per year in cash flow can actually, once amortization, tax benefit, and appreciation are added in, generate over $17,000 of additional “wealth”, for a net positive total return of about $3,200 per year. It is not spectacular, but it is the mechanics of long-term capitalization, boosted by the absence of state income tax in Texas.
When rates durably fall toward 6% (or less), a refinance can turn a slightly loss-making deal into neutral or positive cash flow without touching the principal.
Liquidity: a market rebalancing, with a clear buyer advantage
In terms of liquidity, Austin is in a paradoxical situation: the price correction has cooled some buyers, but the market remains much deeper than that of a secondary city, with a significant share of all-cash transactions in the luxury segment, and fairly rapid turnover for well-positioned properties.
Data shows:
The overall market is considered balanced at 58%, with no extreme imbalance.
On the rental side, liquidity is more mixed. Apartment vacancy is near 10%, following a flood of new housing deliveries (over 30,000 units in 2024 and 17,500 in 2025 in the multifamily segment alone). Rents have fallen 17 to 22% from the 2022 peak, and the market is not expected to absorb this excess supply until 2026–2027, with a return to healthier vacancy around 6–7%.
In other words: it is easier to sell a good product in Austin than to rent it out at a high price in the short term. This is not the profile of an ideal city for the purely cash-flow oriented investor at 12–24 months, but it is a very interesting ground for those targeting resale in 5 to 10 years.
A solid economic base despite the tech cooldown
What makes Austin attractive despite the correction is the solidity of its economic engine. The city experienced the sharpest Sun Belt correction because it issued a massive number of building permits during the boom, but the demand base remains structural:
– massive corporate migrations from California (Tesla, Oracle, Apple, Microsoft, Meta, semiconductor giants like Samsung),
– sustained population growth; the Austin–Round Rock area still ranks among the fastest-growing metros,
– labor market in the top quartile of major US metros, with unemployment around 3.4%,
– sectoral diversification: beyond software, the city relies on advanced manufacturing (chips, EVs), healthcare, defense, life sciences, as well as the stable base of state government (State of Texas, UT Austin).
In parallel, the absence of state income tax remains a powerful draw for senior executives, founders, and wealthy families arbitrating between California, New York, and Texas.
Short-term rental regulations: stricter than you think
Contrary to the image of an ultra-liberal Texas, Austin has fairly tightly regulated short-term rentals, to the point where its former ban on “non-owner-occupied” STRs in residential zones was partially struck down by a federal judge.
In 2025–2026, the city has revised its regulatory framework:
– mandatory license for any STR under 30 days, with significant fees (nearly $800 for a new license, over $300 for renewal),
– two-year validity, non-transferable,
– per-site quotas (maximum STRs per lot, 10% STR share for multifamily, 25% for certain mixed-use sites),
– requirement to display the license number in listings,
– shared responsibility between owners and tenant-operators (with written authorization),
– obligations imposed on platforms (Airbnb, Vrbo…) starting summer 2026: removal of unlicensed listings, transmission of tax information, etc.
Add to that occupancy taxes (11% for the city, 6% for the state), increasingly collected systematically by platforms.
Result: Austin remains feasible for short-term rentals, but in an environment that is increasingly policed and costly. And in a market already very tight on cash flow, betting on a regulated, heavily taxed STR in a temporarily weakened rental market requires a high level of expertise.
Summary: Austin, a long-term city
Austin is consistent for the investor who:
– accepts low or negative cash flow in the short term,
– prioritizes long-term value creation through appreciation and amortization,
– wants a very liquid resale market with solid economic fundamentals,
– takes advantage of the “entry window” opened by the post-2022 correction (prices 15–25% below their peaks, but stabilized),
– does not plan to exit before 2030, as some local players recommend.
For a hunter of immediate yield, Austin is not the best candidate of the three. But for a wealth-building investor with a 5–10 year horizon, able to bear tight cash flow and optimize taxes, it is probably the most interesting option in terms of the “future liquidity / appreciation potential” pair.
Miami vs Orlando vs Austin: who wins on the yield/liquidity pair?
Putting the three markets on the same analytical grid helps clarify trade-offs.
Synthetic comparison of the three cities
| Key Criterion | Miami | Orlando | Austin |
|---|---|---|---|
| Primary Positioning | Capital appreciation, luxury, pre-construction | STR cash flow, tourism | Long-term tech / post-correction |
| Typical Gross Yield (residential) | 5–7% (3–5% on luxury) | 8–10% on STR, ~5–6% on LT | 2–4% on conventional long-term |
| Current Net Yield | 3.5–5.5% depending on neighborhood | 6–12% on good STRs, 4–6% net long-term | 0–3% cash flow, but higher total return |
| Resale Liquidity | Very strong, especially luxury/coastal | Average, slower, depends on zone | Good, especially in sought-after segments |
| Rental Liquidity | Good, multifamily vacancy ~6–7% | Excellent on STR, long-term vacancy still high but declining | Under pressure: high rental vacancy, rents under pressure |
| STR Regulation | Fragmented, restrictive in Miami Beach | Generally favorable but regulated | Increasingly strict, expensive licenses, quotas |
| State Taxation | No state income tax | No state income tax | No state income tax |
| Price Level | Very high in prime areas | More affordable than Miami, but up over 5 years | Intermediate, corrected 15–25% from peak |
Which investor profile suits each city?
Focusing on the yield / liquidity pair, without forgetting risk:
Orlando is recommended for cash flow and high rental yield with solid rental liquidity, provided you target seasonal rentals near the parks. Miami offers a mix of moderate yield and strong resale liquidity with appreciation potential, especially on luxury. Austin is a long-term bet oriented toward capital gains with an attractive entry point since 2019, but often negative cash flow due to property taxes.
How to choose your city without making a mistake: the “personal pair” yield/liquidity method
Beyond the macro numbers, the decision depends mainly on your “personal yield/liquidity pair”, which means:
– the minimum cash-flow level you consider acceptable (neutral, slightly negative, or clearly positive),
– your holding period (3–5 years, 5–10 years, longer),
– your tolerance for active management (STR, multi-tenants, demanding condo association),
– your need for resale liquidity (ability to lock up capital for 7 to 10 years).
A simple way to summarize:
If you seek regular income, optimized bank leverage, and a quick return on cash invested, Orlando is favored. If you prioritize a highly liquid portfolio backed by a deep international market with reasonable but not exceptional net yield, Miami is the choice. Finally, if your goal is to accumulate wealth over 10 years in a major tech city while accepting current cash-flow strain, Austin offers the best risk/return asymmetry.
In all cases, the key remains the same: stop reasoning on the advertised gross yield and work with realistic projections incorporating property tax, insurance, vacancy, management costs, and an exit scenario. Only by reconstructing this complete picture can the yield/liquidity pair of Miami, Orlando, or Austin be judged against your own investor profile.
Have a wealth project or a question? Contact us now to speak with a wealth management expert.
Disclaimer: The information provided on this website is for informational purposes only and does not constitute financial, legal, or professional advice. We encourage you to consult qualified experts before making any investment, real estate, or expatriation decisions. Although we strive to maintain up-to-date and accurate information, we do not guarantee the completeness, accuracy, or timeliness of the proposed content. As investment and expatriation involve risks, we disclaim any liability for potential losses or damages arising from the use of this site. Your use of this site confirms your acceptance of these terms and your understanding of the associated risks.

Cyril Jarnias is an independent expert in international wealth management with over 20 years of experience. As an expatriate himself, he is dedicated to helping individuals and business leaders build, protect, and pass on their wealth with complete peace of mind.
On his website, cyriljarnias.com, he shares his expertise on international real estate, offshore company formation, and expatriation.
Thanks to his expertise, he offers sound advice to optimize his clients' wealth management. Cyril Jarnias is also recognized for his appearances in many prestigious media outlets such as BFM Business, les Français de l’étranger, Le Figaro, Les Echos, and Mieux vivre votre argent, where he shares his knowledge and know-how in wealth management.





