
 Published on and written by Cyril Jarnias
Investing in Real Estate in Brentwood might seem like a simple idea at first glance. In reality, it is a real semantic puzzle for any serious investor: there are several distinct markets bearing this same name, with very different dynamics, prices, and profitability profiles. We are talking about Brentwood, Tennessee; Brentwood, California (Contra Costa County); and Brentwood, the upscale neighborhood in Los Angeles. Each of these markets can offer opportunities, provided you clearly understand where you are putting your money.
This article compares the different Brentwood markets for residential or rental investment. It does not designate a ‘best’ market, but identifies the investor profile suited to each, based on data regarding prices, market dynamics, taxes, and rental yields.
Understanding the Three Major Brentwood Markets
Before diving into the details, it is essential to clearly distinguish the main real estate markets that go by the name of Brentwood.
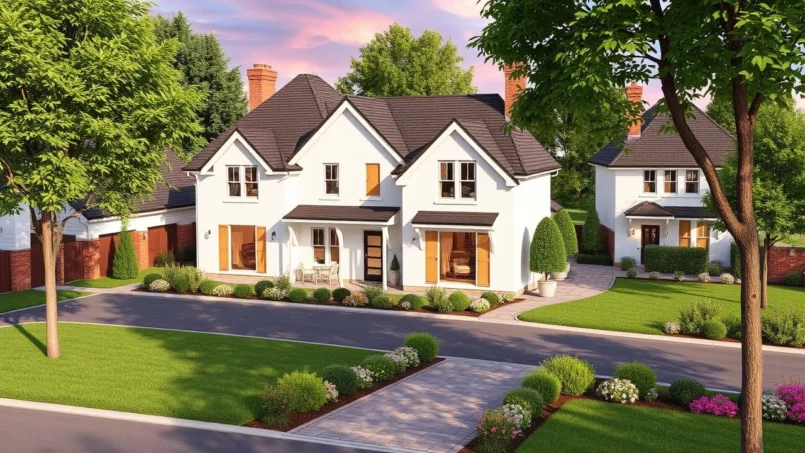
Brentwood, Tennessee, is a city in Williamson County, about 10 miles south of downtown Nashville. With around 45,000 residents, a very high median income, and public schools ranked among the best in the state, the city presents itself as an affluent, family-friendly residential suburb, very green, structured around large subdivisions, enormous houses, and parks. The real estate market here is robust and high-end: a typical home is over $1.3 million, gated communities with golf, master-planned communities with pools, tennis, trails, etc.
Brentwood in California grew from about 23,000 residents in 2000 to over 64,000 today, illustrating its strong population growth.
Finally, Brentwood in Los Angeles is a prestigious neighborhood on the Westside, at the foot of the Santa Monica Mountains, neighboring Pacific Palisades, Bel Air, and Santa Monica. You find spectacular villas, a renovated older housing stock in a “quiet luxury” style, very large lots (over 20,000 sq ft in Brentwood Park), elite private schools, and quick access to both beaches and business hubs. Here, we are talking about an ultra-luxury market: a median sale price well above $3 million, price per square foot around $1,200, luxury single-family homes approaching $5 million.
A first table is presented to visualize and concretely situate the basic differences between the elements discussed, highlighting their respective orders of magnitude.
| Location | Type of Area | Approx. Population | Median Price / Typical Home Value | Median Price per Sq Ft (approx.) |
|---|---|---|---|---|
| Brentwood, Tennessee | Suburb of Nashville | ~45,000 | $1.36M (typical value) | $318–$437 |
| Brentwood, California (Contra Costa) | Bay Area city | ~64–67,000 | ~$770–$790K (median / listing) | $345–$425 |
| Brentwood, Los Angeles (90049) | Upscale West LA neighborhood | ~33,000 | $3.5–$3.8M (listing), $2.3M (sold) | ~$1,200 |
Understanding precisely which Brentwood you are targeting is the absolute condition to avoid building an investment plan based on data that does not apply to the right market…
Brentwood, Tennessee: Golden Suburb of Nashville and a Wealth-Building Market
Brentwood, Tennessee, functions as a high-end residential suburb market. The typical home value is estimated at around $1.36 million, with an increase of about 2.2% over one year. Some indicators even show, over a specific period, a spectacular progression of the median value, on the order of +159% between summer 2024 and summer 2025 according to one WalletInvestor dataset, illustrating the strong upward pressure the market has experienced.
An Ultra-Favorable Socio-Economic Environment
The city stands out for several structural advantages that support property values: very high incomes (median household income above $180,000), an extremely low poverty rate (less than 2% of families), a relatively older population (median age around 44), and a particularly dynamic corporate base, especially in healthcare and corporate headquarters (Tractor Supply, LifePoint Health, Brookdale Senior Living, etc.).
Brentwood benefits from a prime geographic location: just 10-20 minutes by car from Nashville via Interstate 65 and minutes from the Cool Springs business district. The city offers a very green environment with over 40 km of pedestrian and bike paths, parks like Crockett Park or Marcella Vivrette Smith Park, and its public school system (Williamson County Schools) is considered the best in the state of Tennessee.
For an investor, this means a context of sustained demand from end buyers with high purchasing power, willing to pay a premium for homes with large square footage, large lots, and top-tier school options.
Price Levels, Value, and Forecasts
Beyond the typical value around $1.36 million, projections from WalletInvestor models give an idea of the expected trajectory: an increase on the order of 2.7% over one year, moving from about $787,000 to over $808,000 on the value studied by this model, and an anticipated progression of about 17.8% over 10 years, reaching nearly $928,000 by 2035 on the price series used.
Recent data shows a market where the median sale price reaches $1.7 million, with a price per square foot around $318, up 2.6% year-over-year. The city remains nevertheless “somewhat competitive”: an average home sells for about 4% below the listing price and takes 80 to 100 days to go pending, while properties considered “hot” can go at the asking price in a little over 40 days.
This profile corresponds to a prestige market that is more fluid than major coastal metropolises, but where sales cycles remain longer than in more accessible segments.
Neighborhood Overview and Price Range
Brentwood, Tennessee, is structured around large subdivisions, each with its price range, square footage, and amenities. A few benchmarks illustrate the diversity of supply.
| Neighborhood / Community | Current Price Range | Approximate Median Price | Typical Home Size | Features |
|---|---|---|---|---|
| Annandale | $1.5M – $5M+ | ~$2.8M | 5,500–9,000 sq ft | Gated, large lots, Southern Colonial / French Country mansions |
| Belle Rive | $1.5M – $4M+ | ~$2.2M | 4,000–7,000 sq ft | Clubhouse, pool, tennis, trails, near Granny White Park |
| Brenthaven | $1.25M – $5M | ~$1.6M | Very varied (established older neighborhood) | Many areas without HOA, central access to Cool Springs, YMCA, library |
| Governors Club | $1.75M – $6.5M+ | ~$2M | 4,500–7,000 sq ft | 24/7 guarded golf community, Arnold Palmer course, clubhouse, tennis, pool |
| Hearthstone | $700K – $1.3M | ~$1.4M | 2,000–4,000 sq ft | 1980s subdivision, modest HOA (from $160/year), near Granbery Park |
| Hemmingwood | $600K – $1M+ | ~$850K | ~2,500 sq ft (often ranch) | Small subdivision with private lake, one of the most affordable areas |
| Morgan Farms | $1.5M – $2.5M (new construction up to $5M+) | ~$1.75M | >4,000 sq ft | Recent neighborhood (2014), near Smith Park and Nashville Golf & Athletic Club |
| Raintree Forest | $900K – $3M+ | ~$1.5M | 3,000–7,000 sq ft | Pool, tennis, clubhouse, playground, good school network |
| Southern Woods | $800K – $2.5M+ | ~$1.5M | 3,000–10,000 sq ft | 3 pools, tennis, proximity to Governor’s Club and shopping center |
| Windstone | $900K – $4M | ~$1.8M | 4,000–10,000 sq ft | Gated community, Queen Anne & English Classic styles, fishing ponds |
The city therefore offers a spectrum ranging from “affordable” subdivisions (relatively speaking) like Hemmingwood or Hearthstone, to the ultra-luxury enclaves of Annandale or Governors Club. For an investor, this diversity allows targeting either the “upper middle class” family clientele looking for good value in terms of size/amenities/price, or the very high-end tied to golf and large estates.
Rental Yield and Practical Case Study
Available rental profitability figures shed concrete light on what investing in Brentwood, Tennessee means. An example of a home listed at $800,000 in zip code 37027 shows an estimated rent of $4,020 per month. This results in:
– a gross rental yield of around 6.03%,
– a first-year cash-on-cash return estimated at 16.55% with leveraged financing,
– a projected appreciation value over 5 years on the order of $221,000 assuming 5% annual appreciation,
– a cumulative 5-year ROI exceeding 80%.
This market can be profitable over the long term by combining comfortable rental cash flow and steady appreciation. Success requires a controlled debt-to-income ratio and anticipating maintenance costs, especially on large properties.
Local Taxes, HOAs, and Holding Costs
Another advantage of the area comes from taxation. The city’s specific property tax rate is $0.29 per $100 of assessed value, and the overall tax burden remains relatively low: an effective rate around 0.9% on a $500,000 home, or about $4,500 in annual tax. Taxes are due without penalty between October 1 and the end of February, then increased by a monthly penalty of 1.5% if late.
On the other hand, many neighborhoods are organized into Homeowners Associations (HOAs), with typical monthly fees between $100 and $300 (average around $200), covering landscaping maintenance, security, pools, fitness centers, etc. In luxury communities, these amounts can climb beyond $300 per month, occasionally with additional special assessments or seasonal landscaping surcharges.
For a rental investor, these elements must factor into the calculation of Net Operating Income (NOI) and cap rates. In a market like Brentwood, Tennessee, a gross yield above 5–6% is already a respectable performance, with the bulk of value creation over the medium term coming from appreciation and the scarcity of quality supply in a highly sought-after living area.
Brentwood, California (Contra Costa): Controlled Growth and Price / Quality of Life Trade-off
Over 2,000 miles away, Brentwood, California tells a different story: that of a city in the greater Bay Area ring trying to balance population growth, maintaining a certain level of affordability, and developing a hub of services and retail. From 23,302 residents in 2000 to over 64,000 today, the city experienced triple-digit population explosion in the 1990s, followed by a new wave of construction starting in the 2000s.
A Historically Tight Market, but More Accessible than the Bay Core
Recent data shows a market that is both competitive and slightly rebalancing: the typical home value is around $787,000, with a recent decline of about 3.6% year-over-year according to Zillow, but other sources cite an increase over 12 months of about 4.7% or even 8.5% depending on the period. The dynamic is therefore nuanced: the “non-luxury” segment saw values drop by 1.6% to 4.5% over one year, while the overall average value remains moderately up, around 2.4% to 8.5%.
In August 2023, the median sale price stood at $770,000, 6.7% less than the previous year, but homes sold in about two weeks. More recently, another dataset indicates a median sale price of $723,000, down 14.5% year-over-year, with a sale price per square foot of $345 (–4.2%). In any case, the average time to go pending is between 48 and 63 days, compared to barely 30 days the previous year. In other words, the market remains seller-friendly, but less frantic than at the post-pandemic peak.
About half of real estate transactions close above the initial listing price.
Price Levels, Strong Neighborhood Disparities, and New Properties
Median and average values vary by neighborhood.
| Indicator (City of Brentwood, CA) | Approximate Value / Range |
|---|---|
| Typical Value (Zillow) | $787,681 |
| Recent Median Sale Price | $723,000 – $770,000 |
| Median Price per Sq Ft | ~$345–$360 |
| Median Home Value (tax data) | $567,634 to $608,634 |
| Median Annual Property Tax | $7,899 to $8,119 |
| Average Days to Pending | 48–63 days |
| Monthly Sales Volume | 40–80 transactions |
Within the city, certain neighborhoods clearly stand out:
– Deer Ridge / Shadow Lakes, with homes overlooking golf courses, views of the Mount Diablo hills and average prices around $750,000 to nearly $2 million,
– Apple Hill Estates, gated community with tennis courts, private parks, walking trails,
– Garin Ranch, family neighborhood with tree-lined streets, near downtown,
– Rose Garden or Tuscany, newer developments with modern, often energy-efficient homes.
In zip code 94513, there are more than 23,000 residential properties, of which over 22,000 are single-family homes. The median value there is estimated at around $826,800 and the average around $910,000, showing a housing stock where the high and very high end pull the average upward.
New construction projects help renew supply, particularly east and southeast of the city: Apricot Estates, for example, is a new subdivision of 57 single-family homes, with sizes up to 4,397 sq ft, 4 to 5 bedrooms, and prices starting in the “low $1 million” (a concrete listing example sits at $1,311,860 for a 2025 model). Other 55+ communities like Kindred Balfour or The Meadows at Marsh Creek cater to affluent senior demand.
Rental Yields: A Market Where Cash Flow Remains Possible
Brentwood, California is not just a homeowner city: about 22–24% of homes are renter-occupied, with a similarly dynamic rental market. Average rents hover around $3,400 per month, according to some sources, with an increase of about 14–15% year-over-year. Other databases give a lower average (around $2,086) for apartments, reflecting the difference between single-family homes and smaller units.
Analysis of an investment in a new home within a subdivision, including the purchase price, estimated rent, and calculated financial indicators.
New home in the Apricot Estates subdivision, acquired for approximately $1.31 million.
Monthly rent estimated at $4,350, generating annual rental income.
Profitability and return on investment calculations are provided to evaluate performance.
– gross yield of approximately 3.98%,
– first-year cash-on-cash return close to 9.7% with typical financing,
– equity gain through principal repayment of about $8,465 per year,
– assuming 5% annual appreciation, value creation of about $362,000 over 5 years,
– projected cumulative 5-year ROI exceeding 48%.
These figures show that a rental project in Brentwood, CA relies less on explosive cash flow than on moderate leverage and expected medium-term appreciation. For an investor, targeting a cash-on-cash ROI of 5–10% is reasonable in this type of market, while a gross yield below 4% requires ensuring strong occupancy stability and solid capital appreciation potential.
Local Taxation and Value Protection
California property taxation plays a major role in the profitability equation. In Brentwood, the average property tax rate is around 1.11% of value, with an effective median rate sometimes estimated at 1.36% on some datasets. For illustration, a $550,000 home taxed at 1.11% incurs about $6,105 per year.
Proposition 13 limits the annual increase in a property’s taxable base to 2% as long as it is not sold. For a long-term investor, market value often grows faster than the tax base, creating a relative tax advantage for portfolios held for a long time.
Property owners can also request downward reassessments (Proposition 8 Review) when the market declines, or take advantage of partial exemptions (Homeowners’ Exemption of $7,000 off the taxable value for a primary residence, specific programs for seniors or disabled veterans). For an investor, these provisions are not always applicable, but they influence owner-occupant behavior, hence the future supply of homes for sale.
New Supply, Shopping Centers, and Urban Dynamics
On the urban front, Brentwood continues to transform. The shopping center The Streets of Brentwood is undergoing expansion: adding several dining and retail pavilions in front of the cinema, creating new covered patios, modernized signage, arrival of new tenants (Barnes & Noble, Dutch Bros, plans for a La Quinta/Hawthorn Suites hotel or a new Lazy Dog restaurant). Added to this are other developments, such as a 100,000 sq ft medical building led by Sutter Health, or a series of new residences (O’Hara Apartments, new Discovery Homes subdivisions, Stone Brook at Brittlegate with 269 homes, etc.).
These projects enhance the city’s attractiveness – and therefore its ability to absorb new residential supply without collapsing prices. They also increase the depth of the rental market, especially for properties near major roads and employment centers.
For an investor, Brentwood, CA thus appears as a compromise: more affordable than the most expensive communities in the Bay Area, but tight enough to retain appreciation potential and solid rental demand, including from upper-middle-class households, telecommuters, and retirees.
Brentwood, Los Angeles: Ultra-Luxury, Strong Appreciation, and Extreme Selectivity
The third major Brentwood is the most iconic in the media: the Brentwood neighborhood in Los Angeles, zip code 90049. Here, one almost no longer speaks of a “real estate market,” but rather a micro‑market of international luxury. The numbers speak for themselves.
The median listing price for single-family homes reaches approximately $3.5 to $3.8 million, with a price per square foot around $1,200. The luxury single-family home segment sees its median flirt with $5.1 million, after a 47% increase in one year. In summer 2025, the median listing price rose more than 25% over 12 months, even as inventory increased by about 47%.
A Competitive but Less Hysterical Market
One might think that with such price inflation, Brentwood would be a completely locked-down market. In reality, the increase in listings and the deterioration of credit affordability in Los Angeles (credit payment-to-income ratio of 60% in Q3 2024, compared to a national average of 24.9%) have made the market a bit more balanced.
Most indicators show a market that remains in the seller’s favor, but much more negotiable than before:
– more than half of recent sales close below the asking price,
– the average discount from list price is about –2.3%,
– homes sell in 30 to 40 days on average,
– condos trade at median prices around $1.25 million, with a price per square foot around $846.
In other words, high-end buyers have regained some bargaining power, especially on overpriced or technically outdated properties. For an investor, this can mean an opportunity to position themselves on rare assets, provided they master the codes of this hyper-local market.
Area, Style, and Buyer Expectations
Brentwood, LA is segmented into three main zones: Canyon Estates (rustic ambiance, large lots, sometimes horses), The Flats (denser, very walkable neighborhood, near the Brentwood Country Mart), and Brentwood Park (the most exclusive area, with lots exceeding 20,000 sq ft and manor-style residences).
Buyers target properties that combine luxury and discretion, in what local agents describe as a “Quiet Luxury” aesthetic. Preferred styles include:
Local real estate market players
– renovated mid-century modern homes, with open volumes and landscape integration,
– large renovated Spanish or Mediterranean-inspired estates,
– new contemporary villas, with clean lines, natural materials, large windows, and indoor-outdoor continuity.
2025 interiors are characterized by organic materials (wood, stone, lime), soothing color palettes, custom elements (built-in libraries, walk-in closets, banquettes), advanced home automation, and high-end equipment (professional kitchen appliances, integrated audiovisual systems, etc.).
In this context, the typical investment is not that of a small landlord seeking 8% gross yield, but rather that of a family office or private investor wanting to:
Median rents for single-family homes on the Westside can reach $30,000 per month.
High-End Rental Market and Supply/Demand Balance
Brentwood, LA has nearly 254 rental properties, with a rent range from $1,500 for the most modest units (often small apartments) up to $150,000 per month for ultra-prestigious properties. The median rent for single-family homes sits around $30,000, and for condos around $3,295.
The market remains slightly favorable to sellers, but there is a clear flattening of bidding wars. In this context, an investor seeking pure cash flow has little chance of finding high basic yields; however, for significant capital to deploy in a globally recognized market, the combination of high rents and appreciation prospects on a unique asset can constitute a strategic bet.
Comparing Yields and Risk Profiles
To summarize, the three major Brentwood markets present very different price/yield combinations. A simplified comparison helps clarify the issues.
| Market | Typical Entry Ticket (Home) | Typical Gross Rental Yield (examples) | Recent Price Dynamics | Typical Investment Horizon |
|---|---|---|---|---|
| Brentwood, Tennessee | $800K – $1.5M+ | ~6% on case study ($800K/$4,020/month) | +2.2% over 12 months (typical value); +45% on some median sales | Long-term wealth building, cash flow + appreciation |
| Brentwood, California (Contra Costa) | $700K – $1.3M+ | ~4% on new case ($1.31M/$4,350/month) | Mixed variation: –3.6% to +8.5% depending on source and segment | Long-term, bet on Bay Area regional growth |
| Brentwood, Los Angeles | $3M – $5M+ | Highly variable, but often luxury-oriented (rents at $30K/month for homes) | +25–47% on listings and luxury segment | Prestige assets, safe-haven and scarcity strategy |
This comparison highlights several facts:
Brentwood, Tennessee offers an accessible investment with high potential cash flow in a solid socio-economic context. Brentwood, California (Contra Costa), provides a more affordable entry point to the Bay Area, with lower rental yield but population growth and developing infrastructure. Brentwood, Los Angeles, belongs to the ultra-high-end, focused on protecting and growing substantial capital rather than immediate yield.
Technical Parameters for Analyzing a Brentwood Investment
Beyond local specifics, investments in these different Brentwood markets lend themselves to the same analytical tools: capitalization rate (cap rate), cash-on-cash return, appreciation projection, etc.
In all cases, it is crucial to:
– incorporate a prudent vacancy rate (at least 6% in calculations),
– plan for significant annual maintenance costs (1–2% of purchase price for homes, sometimes more on large properties),
– include property management fees even if you manage yourself (to value your time),
– apply a conservative rule of using the lowest plausible rent and the highest expenses.
Experts estimate that a rental investment is generally not worthwhile below a return on equity of 5%. An ROI between 5% and 10% is considered acceptable in premium markets, while a score above 10% is excellent, particularly in highly sought-after areas like the various Brentwood neighborhoods.
In this framework, a rental property in Brentwood, Tennessee, with positive cash flow and a gross yield approaching 6% is positioned very honorably. In Brentwood, California, a yield of 4% is more readily accepted if the land appreciation outlook is judged solid over 10 years. In Brentwood, LA, however, an investor will often prioritize the exceptional quality of the asset and its symbolic value over the pure arithmetic of the cap rate.
Adapting Your Strategy to the Right Brentwood
“Investing in real estate in Brentwood” therefore makes no sense unless you specify which Brentwood you mean, and what the primary objective is: rental yield, wealth appreciation, geographic diversification, or prestige investment.
For a profile seeking cash flow and stability, Brentwood, Tennessee offers a rare combination of high rental income, solid demographics, and reasonable taxes, at the price of an already high but still accessible entry ticket.
For a long-term investor, Brentwood presents a post-2022 normalizing market with prices lower than urban centers. Its attractiveness is reinforced by infrastructure development (retail, healthcare, residential) and solid rental demand.
For an already substantial family asset portfolio seeking a signature asset, Brentwood, Los Angeles remains a symbol of success, with an ultra-luxury market that benefits from a global clientele, limited land supply, and a unique lifestyle (proximity to beaches, the Getty Center, the hills, the Brentwood Country Mart, and a prestigious cultural and educational ecosystem).
To succeed in a real estate investment, it is crucial not to rely on general averages. You must specifically analyze the target segment (type of property, precise location), accurately calculate all costs (rents, taxes, fees, maintenance, vacancy), and surround yourself with professionals possessing strong local expertise. Success depends on data quality, neighborhood choice, and analytical rigor, far more than the simple reputation of the city.
Disclaimer: The information provided on this website is for informational purposes only and does not constitute financial, legal, or professional advice. We encourage you to consult qualified experts before making any investment, real estate, or expatriation decisions. Although we strive to maintain up-to-date and accurate information, we do not guarantee the completeness, accuracy, or timeliness of the proposed content. As investment and expatriation involve risks, we disclaim any liability for potential losses or damages arising from the use of this site. Your use of this site confirms your acceptance of these terms and your understanding of the associated risks.

Cyril Jarnias is an independent expert in international wealth management with over 20 years of experience. As an expatriate himself, he is dedicated to helping individuals and business leaders build, protect, and pass on their wealth with complete peace of mind.
On his website, cyriljarnias.com, he shares his expertise on international real estate, offshore company formation, and expatriation.
Thanks to his expertise, he offers sound advice to optimize his clients' wealth management. Cyril Jarnias is also recognized for his appearances in many prestigious media outlets such as BFM Business, les Français de l’étranger, Le Figaro, Les Echos, and Mieux vivre votre argent, where he shares his knowledge and know-how in wealth management.





