
 Published on and written by Cyril Jarnias
wp-content
Montclair, in Essex County, New Jersey, has been one of the most sought-after real estate markets in the northern part of the state for several years. Between its strong cultural vibe, leafy neighborhoods, renowned schools, and above all its proximity to New York City, the township checks nearly every box that families, young professionals, and savvy investors are looking for.
Montclair’s appeal translates into high prices (homes over one million dollars, rents above the national average) and fierce competition when buying. In return, the market offers strong rental demand, sustained appreciation, and high liquidity, making it a potentially very profitable investment if approached methodically.
1. Why Montclair Draws Investor Attention
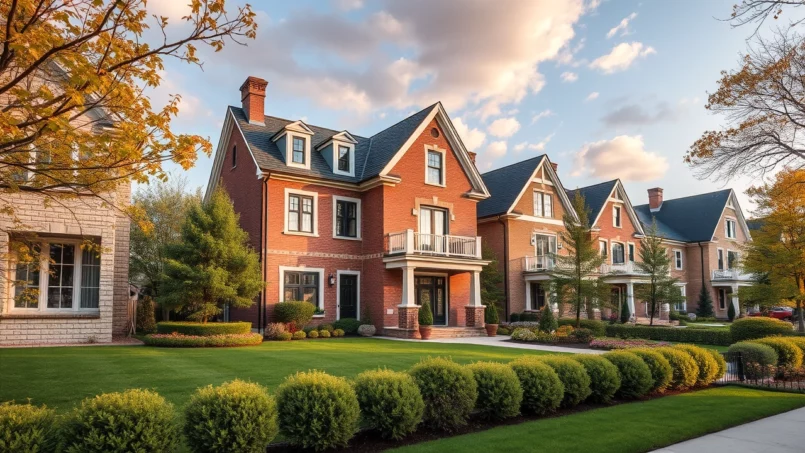
Montclair is often described as a “vibrant” city, at the crossroads of suburban charm and urban amenities. Its tree-lined streets, historic architecture (Victorian, Colonial, early 20th-century manor houses), galleries, theaters, art museum, and numerous restaurants make it a kind of “crown jewel” of Essex County suburbs.
Montclair’s location is a major asset, directly connected to Manhattan via the NJ Transit Montclair-Boonton Line through several stations (Bay Street, Walnut Street, Watchung Avenue, Upper Montclair, Montclair Heights). The trip to Penn Station typically takes between 35 and 45 minutes. This quick access to the heart of New York particularly attracts executives, creatives, and professionals who find a more spacious and peaceful living environment without sacrificing the professional opportunities of the metropolis.
The demographics follow: the population is growing, with a projection of 13,550 residents for the Upper Montclair area alone by 2030 and a growth rate projected at 7.5% between 2020 and 2025. The Aterio Score of 592 out of 1,000 indicates a solid market, without being completely “overheated,” in a context where the overall U.S. population is only expected to grow by 4.7% between 2020 and 2030.
The local economic fabric is robust, the population is educated, and incomes are high. In Upper Montclair, the average individual income exceeds $109,000, with households averaging more than three people. This socio-economic profile largely explains the residents’ ability to absorb high purchase prices and rents above national standards.
2. One of the Most Competitive Sales Markets in the Country
Montclair doesn’t resemble an “average” American market. Data shows an extremely competitive environment, both in price levels and dynamics.
2.1 Price Levels and Recent Trends
Depending on the source, several figures coexist, but all converge on the same reality: Montclair is a high-end market for the region.
We find thus:
| Indicator | Approximate Value | Source / Period |
|---|---|---|
| Typical Home Value (ZHVI) | $1,078,256 | Zillow, data through Nov. 2025 |
| Median List Price of Homes for Sale | $1,150,000 | Recent local data |
| Median Listing Price | $1.2M | September 2025 |
| Median Sale Price (last month cited) | $1.5M (+17.7% YoY) | Local market late 2025 |
| Price per Square Foot (citywide) | $429 | Aggregated data |
| Price per Square Foot (recent period) | $538 (+9.3% YoY) | Recent transaction statistics |
Over the long term, the progression is clear. Average values in Montclair City rose from around $586,000 in 2009 to over $700,000 in 2022. Over the past three years, the median has jumped over 27%, and the price per square foot by about 26.8%. Projections remain upward in the medium term, with scenarios envisaging a rise of about 12% over ten years and a projected price beyond $830,000 by 2035 for the tracked index.
In detail, the market is strongly segmented:
| Property Type (approx. order) | Indicative Price Range |
|---|---|
| 2–3 bedroom starter homes | $600,000 – $750,000 |
| 3–4 bedroom family homes | $800,000 – $1.2M |
| Large houses and prestige homes | $1.5M – over $3M |
| Overall range of recent sales | $160,000 – > $4.5M |
| Known record (Aaron Rodgers purchase) | $9.5M |
| Average price for multi-families (sample) | $3.65M |
| Average price per unit in apartment buildings | $162,000 |
In the ultra-high-end segment, properties like “Daybreak” on South Mountain Avenue at $7.5M or a home on Gates Avenue at $8.5M illustrate the rise of the luxury market. Local professionals note that the symbolic threshold has shifted: where $2M once marked a limit, it is now more like $3M that serves as a benchmark.
2.2 Turnover Speed and Supply/Demand Ratio
Montclair’s uniqueness also lies in the speed at which properties sell and the premiums paid over asking price. The indicators are telling:
| Market Dynamics Indicator | Typical Value |
|---|---|
| Average days on market before pending (Zillow) | ~13 days |
| Median days on market (another period) | ~22 days |
| Average days on market reported by Redfin (last month) | ~53 days (after a very tight year) |
| Average number of offers per property | ~5 offers |
| Sale-to-list price ratio | ~116% |
| Average premiums observed | 16–18% above asking price |
| Premiums on highly sought-after properties | Up to 32–34% above asking price |
Montclair has even been ranked “hottest market in New Jersey” and fourth nationally by Realtor.com, based on unique listing views and speed of sales. The equation is simple: limited inventory, a very broad buyer base (especially from New York), and solid local fundamentals (transit, schools, downtown vibe). For an investor, this means two things: exceptional liquidity when reselling, but also difficulty entering the market without a strategy and financial preparation.
2.3 2026 Trends: Toward a Slightly More “Normal” but Still Tight Market
Regional analyses predict for 2026 a northern New Jersey market in an adjustment phase: less frenzy than in the post-Covid years, more moderate price increases (2 to 4% per year expected statewide), stricter financing conditions, but still robust demand in well-served cities like Montclair.
This represents the number of months of available housing inventory in New Jersey, illustrating the limited supply on the market.
3. A Very Tight Rental Market, Ideal for Rental Investment
For an investor, the other leg of return after appreciation is rents. On this front, Montclair also stands out with high levels and sustained demand.
3.1 Rent Levels and Market Structure
Various sources converge on one observation: renting in Montclair costs significantly more than elsewhere in the United States.
| Rental Indicator (citywide) | Approximate Value / Period |
|---|---|
| Median rent all sizes (Dec. 2025) | $2,842 / month |
| Average rent (other source, summer 2025) | $2,850 / month |
| Average apartment rent | $2,612 / month |
| Average single-family home rent | $3,800 / month |
| Difference from national average (various sources) | +36% to +48% |
| General range of advertised rents | $1,700 – $17,900 |
| Number of rental properties listed (2025) | ~118 to 125 |
By property type or size, the grid is as follows:
| Unit Type | Average Monthly Rent (approx. order) |
|---|---|
| Studio | $1,955 – $2,031 |
| 1 bedroom | $2,050 – $2,377 |
| 2 bedrooms | $2,775 – $2,982 |
| 3 bedrooms | $2,775 – $3,750 (up to ~$3,704+) |
| 4 bedrooms | ~$5,000 |
| Condo | ~$2,044 |
| Room in shared housing | ~$2,593 |
The average rent level implies, according to the classic rule of not exceeding 30% of income for housing, a recommended annual income of about $95,000. This aligns well with the income profile of Montclair households and commuters from New York.
Rental demand remains strong despite a recent slight decline in median rents (-3% month-over-month, -5% year-over-year), while supply increases (+14% year-over-year). The market shows wide dispersion by unit type, with increases in some segments (e.g., 3 bedrooms) and decreases in others (e.g., studios, large 4 bedrooms), signaling a rebalancing phase.
3.2 Rental Pressure by Neighborhood and Zip Code
Montclair is far from homogeneous. From one neighborhood to another, rents and sale prices vary significantly, opening up interesting arbitrage opportunities for investors.
| Neighborhood / Area | Median Sale Price | Median Rent | Average Days on Market (Sale) |
|---|---|---|---|
| Montclair Center (hyper-center) | $1,249,000 | $2,600 | ~21 days |
| Montclair (overall, aggregated data) | $859,000 | $2,900 | ~25 days |
| Montclair South End | $769,500 | $2,600 | ~28 days |
| Broughton Avenue | $474,500 | $2,375 | ~18 days |
| Upper Montclair Historic District | — | $2,500 | — |
| Town Center Historic District | — | $2,300 | — |
| Pine Street Historic District | — | $2,370 | — |
And by zip code in the greater Montclair / vicinity area:
| Zip Code | Median Home Price | Median Rent | Price per Sq Ft |
|---|---|---|---|
| 07042 | $1,122,500 | $2,850 | $416 |
| 07043 | $1,125,000 | $3,000 | $437 |
| 07028 | $925,000 | $4,350 | $373 |
| 07044 | $635,000 | $2,925 | $330 |
Areas centered around train stations, the shops of Bloomfield Avenue or Church Street, and highly reputed school neighborhoods naturally drive values upward. Conversely, pockets like South End or Broughton Avenue still offer more affordable entry points while remaining well-connected.
3.3 Strong Structural Demand: Students, Commuters, Families
If rental tension is high, it is not solely due to sale prices. Several engines structure demand:
Rental demand in Montclair, New Jersey, rests on three main pillars. First, New York commuters are attracted by the offering of spacious houses with yards, combined with a vibrant downtown and a direct rail link to Manhattan—a major advantage since hybrid work became widespread. Second, Montclair State University generates a constant flow of students, faculty, and staff looking for housing. The student rental segment is particularly profitable, with off-campus shared house rents (around $1,000 per person) remaining competitive compared to university housing ($1,300 to $1,500 per month). Third, families seeking elite schools are willing to pay a premium to settle in a highly rated public school district (ranked 21st in New Jersey) or near the city’s many private schools.
Result: even with very high rents, vacancy remains low and rent levels sustain a plateau above the national average and even the state average, which reinforces the appeal of rental investment, despite significant purchase prices and local taxes.
4. Understanding the Neighborhoods: Where to Invest in Montclair
Investing in Montclair isn’t just about “buying in Montclair.” The micro-markets are highly contrasted. Each neighborhood has its tenant profile, price levels, and appreciation prospects.
4.1 High-End Safe Bets
Several areas are emblematic of Montclair’s prestige and cater more to a “heritage” or luxury positioning.
Upper Montclair stands out for its wide avenues, stately homes, parks (like Anderson Park), the shops of Bellevue Avenue, and proximity to the Upper Montclair station. It is one of the neighborhoods with the highest average incomes, relatively low density, and a very residential environment. Prices reflect this exclusivity, with family homes often above one million dollars and rents structured for a high-end clientele.
The most prestigious sectors, characterized by historic properties on large lots, representing the top of the value pyramid.
Homes that can reach several million dollars, in a niche market driven by wealthy, sometimes famous buyers. Value rests on potential appreciation and scarcity of properties.
Historic properties on large lots. Seasonal or long-term rental is possible, but the core value lies in their exceptional character and rarity.
Montclair Heights mixes beautiful residences with views of the New York skyline and proximity to the Montclair State University campus. This is an interesting area for targeting a mixed clientele (families + graduate students / professors) and capitalizing on the prestige of the views and university demand.
4.2 Lively Centers and Walkable Neighborhoods
Montclair Center / Downtown Montclair is the cultural and commercial heart: Bloomfield Avenue and Church Street concentrate restaurants, cafes, shops, galleries, the Wellmont Theater, etc. Here, the appeal is primarily urban: walking, going out, living without necessarily depending on a car.
For an investor, these streets and their immediate surroundings offer fertile ground for mixed-use buildings (ground-floor commercial + residential upper floors), condos, and small apartment complexes. The median rent of $2,600 in Montclair Center, combined with a median price of $1.249M, gives fairly tight rent multipliers, but compensated by very low vacancy and high liquidity upon resale.
With its station, its farmers’ market (Walnut Street Farmers’ Market), and its neighborhood shops, it operates on the same model on a more intimate scale. Proximity to the station and neighborhood life directly impact rents and property values.
Walnut Street
Watchung Plaza, organized around a station with old-world charm, offers a micro-neighborhood of the “village” type, very popular with executive families who want to do everything on foot (schools, coffee, breakfast, train). Land there is scarce, but a well-placed income property will almost always find a taker.
4.3 “Catch-up” Areas and Opportunities
At the opposite end of the spectrum, some still-transforming neighborhoods offer more accessible entry points while retaining upside potential.
South End is often described as an area in “renaissance”: new projects, commercial revitalization, more affordable housing than in northern Montclair, but with decent access to major roads and transit. The median price around $770,000 for a home, with median rents around $2,600, allows targeting a slightly higher rental yield than the Montclair average, especially if buying a fixer-upper with a “value-add” approach.
Pine Street is another example, marked by redevelopment projects, the arrival of new businesses, and an still affordable residential offering compared to the most expensive sectors. Investors find fertile ground there for small buy-renovate-sell operations or building a rental portfolio while anticipating gradual value adjustments.
Brookdale, to the north, presents a more family-oriented profile, with Brookdale Park as a major asset, and a classic suburban atmosphere. Prices remain high, but slightly below the most upscale zones, which can suit a long-term rental strategy for families seeking peace, parks, and good schools.
Finally, neighboring municipalities—Glen Ridge, Verona, Cedar Grove, Bloomfield, West Orange, Clifton—are directly impacted by Montclair’s aura. Some, like Bloomfield or West Orange, offer more reasonable prices and benefit from rental demand stimulated by proximity to Montclair, making them “satellite” markets to watch for diversifying exposure while staying in the same living area.
5. Investment Strategies Adapted to Montclair
High prices and local taxation require being particularly disciplined in choosing a strategy. Several approaches are well-suited to the Montclair context.
5.1 Buy-and-Hold on Quality Properties
Given the historical trend of appreciation (over 22% over five years, 18-22% anticipated over 2025–2030), a long-term hold strategy on well-located properties makes sense. The idea: accept a moderate net rental yield in exchange for a high probability of long-term capital gains and excellent liquidity upon resale.
This strategy works particularly well:
– near NJ Transit stations (Bay Street, Walnut Street, Upper Montclair, Montclair Heights…),
– in the most sought-after school districts,
– in downtown areas with dense services.
In these sectors, even if immediate gross profitability isn’t spectacular, demand remains strong in any economic climate, reducing the risk of prolonged vacancy and protecting long-term value.
5.2 Income Properties and Multi-Families
Montclair has an interesting proportion of two-family homes, three-family homes, and small apartment buildings. These properties are particularly suitable:
Several approaches can optimize a rental investment: building a portfolio with multiple units to spread vacancy risk, ‘house hacking’ where the investor lives in one unit and rents out others, and ‘value-add’ operations such as modernizing units or improving energy efficiency to justify higher rents.
The example of a recent two-family home near Bloomfield Avenue, listed at about $1.4M with six bedrooms and five bathrooms, illustrates the type of product targeted by a clientele of high-income renters, or even upscale shared housing.
With an average price per unit around $162,000 in multi-family transactions, the comparison with markets like Newark or the rest of Essex County shows that Montclair sits at the high end, but tenant quality, rent stability, and appreciation partly offset this extra cost.
5.3 House Hacking and Student Rentals
House hacking makes perfect sense in an expensive city like Montclair. By buying a duplex or triplex and living in one unit, an investor can have the other rents cover all or part of the mortgage payment, taxes, and maintenance. In some cases, it is even possible to live almost “rent-free” while building equity in the property.
The presence of a university, such as Montclair State University, offers a significant student rental market. By organizing shared housing in suitable homes, it is possible to generate rents well above a standard lease. To succeed, it is essential to comply with municipal regulations, especially those regarding short-term rentals and occupancy density, and to be rigorous about managing turnovers, move-in/move-out inspections, and tenant screening.
5.4 Targeted Fix-and-Flip
The Montclair market lends itself to this, but only in a very specific segment: fixer-uppers in well-located areas. With often short selling times and significant premiums over asking price for “turnkey” products, it is possible to capture part of that value by carrying out quality renovations.
For the operation to work, the investor must master:
– the cost of work (including a safety margin),
– the price per square foot of renovated properties in the targeted micro-neighborhood,
– the resale timeline (to minimize holding costs and exposure to rate fluctuations).
Loans like hard money or bridge loans—especially offered in Montclair by players like RFG or Montclair Capital—can finance this type of short-term project, with ratios based on after-repair value (ARV). In this case, it is crucial to lock in the exit strategy in advance (resale or long-term refinancing).
6. Financing and Taxation: Balancing Yield and Security
In a market where the average home price hovers around $1.1–1.4M and property taxes run around 3% of value, the financial structuring is decisive for actual profitability.
6.1 Overview of Financing Options
Investors in Montclair can tap into a wide array of tools:
– Conventional mortgages (banks, credit unions): lower rates but require a significant down payment (often 20 to 25% for investment properties) and strict income requirements.
– FHA loans with 3.5% down possible on buildings up to 4 units, provided the owner occupies one unit (especially suited for house hacking).
– DSCR loans (Debt-Service Coverage Ratio) designed for rental properties, where the decision relies more on the property’s ability to generate sufficient cash flow than on the borrower’s personal income.
– Hard money and private loans for short-term operations (fix-and-flip, renovation, light construction), with higher rates but greater flexibility, sometimes up to 75% of after-repair value.
– Lines of credit like HELOCs or home equity loans to reinvest equity already built up in a first property.
– Commercial financing / agency debt (Fannie Mae, Freddie Mac) for larger buildings.
For a project, the capital stack can combine different types of financing: senior debt, subordinated (or mezzanine) debt, and equity contributions. The chosen structure depends on the size and complexity of the project.
6.2 Impact of Property Taxes and Relief Programs
New Jersey is one of the U.S. states with the highest property taxes. In Montclair, for its part falling under Essex County, the median effective tax rate is around 3.3%, with a median property tax bill over $19,000, and around $20,000 in some zip codes like 07043.
Concretely, for a home at $850,000, one could face an annual tax bill close to $23,800, or nearly $2,000 per month added to the debt service. This “carrying cost” weighs heavily in the rental cash flow calculation.
The state has nevertheless implemented several programs for residents, notably seniors, who can benefit from rebates or reductions through programs like Senior Freeze, ANCHOR, or Stay NJ. These programs do not directly lighten the burden for an investor-landlord who does not meet the criteria, but they influence the ability of owner-occupants to stay in place, thus the overall market dynamics.
For an investor, it is essential to factor in:
For a rental investment in the United States, it is essential to know the main tax advantages: property taxes and mortgage interest are deductible. The building portion of the property can be depreciated for tax purposes over 27.5 years. Finally, upon resale, it is possible to defer capital gains tax through a 1031 exchange, provided the proceeds are reinvested in another rental property.
These tax levers can transform a modest gross yield into a much more attractive net after-tax return, especially for taxpayers in higher brackets.
6.3 Calculating Yield: Beware of Illusions
With high prices and strong rents, the rent-to-price ratio in Montclair is not always spectacular if one settles for a simple gross calculation. The investor must therefore:
– incorporate into projections an annual maintenance budget of about 1 to 4% of the property’s price (the famous “1% rule” for maintenance),
– adjust expected rents based on property type, exact location (neighborhood, distance to station, school quality), property condition, and latest market trends (some housing sizes see rents declining, others increasing),
– account for technical vacancy (even modest) between tenants,
– take into account management fees if using an agency.
Where Montclair compensates handsomely is on the appreciation + liquidity front: the probability of exiting an investment quickly, even in a softer period, remains much higher than in many secondary markets.
7. Specific Risks and How to Manage Them
Investing in Montclair means betting on a premium market. Like any such market, it carries risks to monitor.
7.1 Cyclical Risk and Local Overvaluation
Some forecasting models, like those of Walletinvestor, envision the possibility of a price correction over 12 months in the short term, even if other analyses rather expect continued increases. In a context of higher interest rates (6.5–7% for recent residential mortgages), some buyers may be priced out, which could slow price growth, especially in the very high-end segments.
The investor should therefore:
For a resilient real estate investment, it’s crucial to avoid purchases based solely on the assumption of rapid appreciation. You must absolutely stress-test your financial projections by incorporating unfavorable scenarios, such as stagnation or even a slight price decline. Finally, prioritize properties where the rental cash flow generated covers all expenses comfortably, even in the event of rising interest rates or tax increases.
7.2 Vacancy, Management, and Regulatory Risks
Even in a tight market, vacancy exists, especially if you overestimate the acceptable rent level for a given property. Classic risks also weigh on any rental investment:
– rent defaults,
– damage,
– legal disputes (leases, security deposits, repairs…),
– regulatory changes (for example, regarding short-term rentals).
In Montclair, rules on Airbnb-type rentals are regulated: investors who planned to rely heavily on this model must inform themselves precisely about the conditions (permits, limitations, primary residence requirements, etc.) before building their business plan.
Good mitigation involves:
To secure a rental investment, three actions are essential: conduct rigorous screening of tenant candidates, hire an experienced property manager (especially for multi-property portfolios), and set up an appropriate legal structure, such as an LLC, coupled with an extended liability insurance policy, to protect against litigation risks.
7.3 Geographic Concentration Risk
Montclair offers very strong fundamentals, but remains a limited-sized city in a high-tax state. More advanced investors therefore benefit from diversifying their exposure:
– by combining Montclair with neighboring markets (Bloomfield, West Orange, Clifton, Verona, Glen Ridge, Maplewood, South Orange, etc.),
– by diversifying property types (single-family homes, condos, multi-families, commercial spaces in mixed-use buildings),
– by balancing assets between very premium markets like Montclair and more affordable but dynamic markets (Newark, Jersey City, Paterson, etc.).
This diversification allows benefiting from the solidity of a “trophy” market like Montclair, while limiting the risk of a more pronounced local downturn.
8. How to Structurally Build an Investment Project in Montclair
To best exploit the city’s potential, it is useful to follow a structured approach rather than being guided by impulse.
8.1 Define Your Profile and Strategy
First step: clarify whether you position yourself more as:
– heritage investor (priority on security, prime location, long-term capital gains),
– cash-flow oriented investor (seeking superior rental yields, including in peripheral areas or fixer-uppers),
– hybrid investor (combining prime location with some higher value-added operations).
In Montclair, heritage and hybrid profiles are generally the most suitable, given the entry cost and taxes.
8.2 Target the Right Sub-Markets
Depending on the strategy:
For a heritage investment, favor Upper Montclair, Montclair Center, immediate vicinities of train stations, well-rated school sectors, and parts of Estate Section and Montclair Heights. To improve cash flow, look toward South End, Pine Street, certain portions of Broughton Avenue, and neighboring towns like Bloomfield, Clifton, and West Orange, which benefit from Montclair’s attractiveness at more affordable prices. Finally, for student or young professional housing, focus your search near Montclair State University and along transit lines, notably in Montclair Heights, around Walnut Street, or in some sectors of Brookdale.
8.3 Solidify the Financial Structure
The typical combination for a first investment in Montclair would be a significant down payment (20 to 25% minimum), a conventional or DSCR loan, and good anticipation of the “property taxes + insurance + maintenance” line item.
In a house hacking scenario, using an FHA loan for a 2-to-4-unit property allows reducing the down payment to around 3.5%, provided you occupy one of the units. This strategy is particularly effective in expensive real estate markets, as rents from the other units can cover a large portion of the total monthly loan payment.
8.4 Surround Yourself with Local Professionals
The Montclair market operates heavily on “off-market” deals, networks, and a fine understanding of micro-zones (a single street can make a difference). Collaborating with:
– a real estate agent specialized in Montclair and its surroundings,
– a mortgage broker accustomed to investor files,
– a tax advisor familiar with New Jersey taxation,
allows gaining efficiency, avoiding pitfalls (overpriced listings, compliance issues, hidden renovation costs), and maximizing profitability levers.
9. In Summary: Montclair, a Demanding but Highly Promising Market
Montclair brings together a set of factors rarely aligned in a single city: immediate proximity to New York, walkable downtowns, rich cultural and culinary offerings, top-ranked schools, a character housing stock, a wealthy and growing population base, and a real estate market recognized as one of the most competitive in the country.
The flip side of this coin is well-known: high purchase prices, heavy property taxes, fierce competition among buyers and investors, sometimes compressed rental yields if one pays too much at entry. Yet, for a disciplined investor who:
– chooses their neighborhoods carefully,
– builds a solid financial structure,
– anticipates taxation and maintenance,
– and surrounds themselves with seasoned professionals,
Montclair can become a cornerstone of a real estate portfolio oriented toward quality, resilience, and long-term appreciation.
Montclair
In a New Jersey where premium suburbs like Montclair, Maplewood, South Orange, or Princeton should remain highly sought-after, positioning oneself in Montclair amounts to betting on a rare asset: a city that has managed to transform over the past 20 to 30 years without losing its identity, and that continues to attract both residents and capital, year after year.
Disclaimer: The information provided on this website is for informational purposes only and does not constitute financial, legal, or professional advice. We encourage you to consult qualified experts before making any investment, real estate, or expatriation decisions. Although we strive to maintain up-to-date and accurate information, we do not guarantee the completeness, accuracy, or timeliness of the proposed content. As investment and expatriation involve risks, we disclaim any liability for potential losses or damages arising from the use of this site. Your use of this site confirms your acceptance of these terms and your understanding of the associated risks.

Cyril Jarnias is an independent expert in international wealth management with over 20 years of experience. As an expatriate himself, he is dedicated to helping individuals and business leaders build, protect, and pass on their wealth with complete peace of mind.
On his website, cyriljarnias.com, he shares his expertise on international real estate, offshore company formation, and expatriation.
Thanks to his expertise, he offers sound advice to optimize his clients' wealth management. Cyril Jarnias is also recognized for his appearances in many prestigious media outlets such as BFM Business, les Français de l’étranger, Le Figaro, Les Echos, and Mieux vivre votre argent, where he shares his knowledge and know-how in wealth management.





