
 Published on and written by Cyril Jarnias
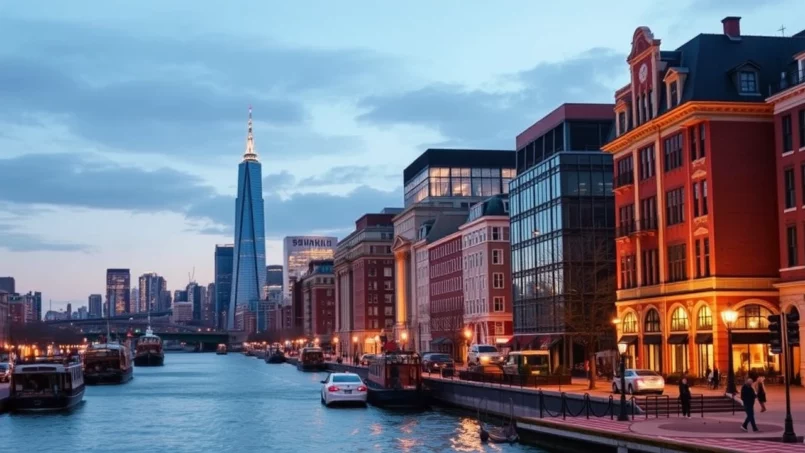
Historic capital of New England, a campus city teeming with prestigious universities and driver of American biotech, Boston concentrates in a few neighborhoods a density of wealth, skilled jobs, and urban projects rarely found elsewhere in the United States. For a real estate investor, this combination creates a market that is both very promising and fiercely demanding: high entry prices, tight regulation, fierce competition… but also a depth of rental demand and economic resilience that is hard to match.
The goal of this article is to provide a structured overview for investing in Boston real estate, by intersecting three dimensions: the residential market (buy to rent or to resell), major urban and regulatory dynamics, and the commercial side (offices, retail, warehouses, labs, REITs, etc.).
Everything is based on detailed data and reports on Boston and its metropolitan area, without extrapolation or free promises of returns.
An expensive city, but backed by solid fundamentals
Boston is regularly ranked among the most expensive U.S. metro areas. The median home price hovers around $800,000, with recent sources citing a level “close to $850,000” in spring 2025. The price per square foot is in a high range, between roughly $679 and $697 per square foot, depending on the reports consulted.
The market is not only expensive, it is tight. The rental vacancy rate in the metropolitan area was measured at 0.4% at the end of 2023, while other sources indicate a vacancy rate of around 5.5% citywide for certain segments. In any case, the key idea is the same: over 99% of rental housing is occupied at any given time according to some analyses, which explains the robustness of rents.
Demographic pressure and economic engine
A few figures help to understand why investing in Boston real estate remains attractive despite the prices:
Over 4.3 million people make up the city’s metropolitan area.
The dominant sectors are healthcare, education, finance, and especially tech and biotech. Giants like Google, Amazon, Microsoft, Meta, as well as numerous pharmaceutical labs, have established or strengthened their presence in the region, particularly in Cambridge, Kendall Square, the Seaport District, and Fenway.
Boston’s specific local economy explains the continuous rise in prices over two decades, even during unfavorable national economic conditions. Studies illustrate this resilience: the market rebounded faster than other major cities after the 2008 crisis and quickly absorbed the shock of the student oversupply following the Covid-19 pandemic.
An expensive market… but relatively stable
While stock market volatility worries some savers, real estate in Boston is described by professionals as an ” extraordinarily stable” asset: it protects patrimonial value but also creates a barrier to entry for the middle class.
Recent projections anticipate a moderate increase in prices (on the order of 2 to 4% per year) in the coming years, with local scenarios sometimes predicting a slight symbolic correction (up to –1.6% over one year according to certain platform forecasts) rather than a true downturn. In other words, it’s more about a “recalibration” of the market than a bubble ready to burst.
Rent overview: a tight rental market
Boston rents reflect this strong demand. Several reports give slightly different figures depending on the calculation method (average, median, type of housing), but the general trend is clear: renting in Boston is very expensive, and this cost forms the basis of investor profitability.
Rent levels by property type
We can summarize the orders of magnitude found in various studies:
| Indicator | Approximate Value |
|---|---|
| Average overall rent (all types) | $3,258 to $3,667/month |
| Average 2-bedroom rent | ≈ $3,200/month |
| Average 3-bedroom single-family home rent | ≈ $4,500/month |
| Average gross rental yield | ≈ 4.56% |
| Target rent/price ratio (local rule) | 0.7% to 0.8% |
The famous “1% rule” (a monthly rent equivalent to 1% of the purchase price) is simply not realistic here: in Boston, a ratio of 0.7 to 0.8% is considered acceptable given the property appreciation and stability of demand.
One report illustrates housing costs on a citywide scale by mentioning typical rents for one- and two-bedroom apartments.
| Neighborhood (older but indicative references) | 1 Bedroom (approx.) | 2 Bedrooms (approx.) |
|---|---|---|
| Downtown | $2,500 | $3,400 |
| Back Bay | $2,300 | $3,000 |
| South Boston | $2,000 | $2,600 |
| Allston/Brighton | $1,800 | $2,200 |
| Cambridge | $2,400 | $3,100 |
These amounts have since increased further, but provide a relative scale between neighborhoods.
National ranking: Boston among the most expensive cities
A late 2024 report ranked Boston 4th among the most expensive U.S. cities for renting a one-bedroom apartment, with a median around $2,750 for this type of unit. Other data indicates a citywide median rent at $2,466 in summer 2025.
The gaps between average and median figures, or between time periods, are due to the variety of housing stock (student studios, luxury condos, townhouses, etc.) and the more or less broad inclusion of the metropolitan area in the statistics.
Understanding the neighborhood map: from luxury to transitioning areas
Investing in Boston real estate requires a good reading of the city’s fine geography. From one subway stop to the next, the population profile, rent level, appreciation potential, and risks of vacancy or crime can change.
Premium neighborhoods: Back Bay, Beacon Hill, Seaport, South End, West End
These areas concentrate the highest prices, but also a creditworthy clientele and very low vacancy rates.
Back Bay, for example, epitomizes the prestigious address: rows of Victorian brownstones, proximity to the Boston Public Garden, upscale boutiques on Newbury Street, views of the Esplanade along the Charles River. Rents here are among the highest in the city:
| Premium Neighborhood | Average 1-Bedroom Rent (approx.) | Average 2-Bedroom Rent (approx.) | Dominant Profile |
|---|---|---|---|
| Back Bay | $3,250–$3,500 | ≈ $6,083 | Executives, wealthy families, expats |
| Seaport District | Median 1BR ≈ $3,957 | — | High-end, tech, biotech, finance |
| South End | Median 1BR ≈ $3,448 | ≈ $4,767 | Creatives, executives, young families |
| West End | Median 1BR ≈ $3,643 | — | Close to Financial District, TD Garden |
The Seaport District deserves special mention. A former industrial port area, it has seen over $22 billion in public investments and has become an ultra-modern neighborhood of glass towers housing corporate headquarters, labs, luxury hotels, and residences. In 2024, it was the most expensive neighborhood for renting a home in Boston for nearly every month of the year.
For an investor, these premium areas offer:
– very high liquidity (ease of resale),
– structurally low vacancy,
– an international and corporate clientele (expats, transferred executives, consultants).
Gross yields are often lower because acquisition prices have already largely factored in future appreciation prospects.
Intermediate and “lifestyle” neighborhoods: Fenway, Jamaica Plain, South Boston, North End
These neighborhoods combine lifestyle appeal, good transit access, and high rents, but are sometimes slightly more accessible than ultra-prime areas.
Fenway–Kenmore, for example, is a student, sports (Fenway Park, home of the Red Sox), cultural (Museum of Fine Arts), and medical (Longwood Medical Area) hub. With a walk score of 95 and a transit score of 93, accessibility is optimal. Rents for a two-bedroom there average over $5,400 per month, in a market very active with students, medical residents, and young professionals.
Jamaica Plain, southwest of downtown, appeals with its greenery (Jamaica Pond, Arnold Arboretum), residential character, and community engagement. Rents are high (around $2,500 to $3,000 for a one-bedroom), but the atmosphere is more family-oriented, with many Victorian houses and triple-deckers.
South Boston (Southie) combines the advantages of a waterfront, proximity to downtown, good transit access, and rapid transformation. The rental market is strong, with median rents around $3,200 for a studio and $3,700 for a two-bedroom. Demand is high, driven by young professionals as well as families attracted by the quality of life and neighborhood schools.
The North End, finally, is Boston’s “Little Italy”: narrow streets, Italian restaurants, immediate proximity to the waterfront and downtown. Rents there commonly exceed $2,500 for a one-bedroom, with near-perfect walk and transit scores (99).
Transitioning neighborhoods and growth opportunities: Dorchester, East Boston, Roxbury, Mattapan, Allston-Brighton
For investors seeking a better return/appreciation potential balance, more peripheral or historically working-class neighborhoods are increasingly drawing attention.
Dorchester, the largest neighborhood in Boston, is emblematic. With a median rent of about $2,400 for a one-bedroom, it remains cheaper than downtown but benefits from:
– a great diversity of populations,
– numerous typical triple-deckers,
– the arrival of large projects like Dorchester Bay City, with nearly 1,957 planned housing units, about 20% of which are rent-restricted.
A neighborhood on the rise, close to downtown and Logan Airport, attracting young professionals and students.
Proximity to downtown and Logan International Airport. Appeal for young professionals and students, especially around Piers Park and LoPresti Park.
The median rent for a one-bedroom there is around $2,486.
Recent developments like The Mark at DeNormandie Wharf (107 condos) demonstrate growing interest in this once more industrial waterfront.
Roxbury and Mattapan, long marked by socio-economic stigmas, are gradually changing their image. Roxbury is recognized for its cultural richness and history (Malcolm X, Martin Luther King Jr.). The median rent for a one-bedroom is on the order of $2,550, with decent transit access. Mattapan, meanwhile, offers average rents around $2,600 per apartment, driven by a diverse community and transit options like the Mattapan Trolley and bus.
Finally, Allston–Brighton is a large student and young professional area, historically attached to Boston since the 19th century. It features a mix of apartment buildings, triple-deckers, and small houses, with rents around $2,250 for a one-bedroom in Allston, and a very “campus” atmosphere around Boston University, Harvard, and Boston College.
We can compare some average one-bedroom rents by “intermediate” or “transitioning” neighborhood:
| Neighborhood | Average 1 Bedroom Rent (approx.) |
|---|---|
| Allston | ≈ $2,250 |
| Brighton | Median ≈ $2,376 |
| Dorchester | Median ≈ $2,400 |
| East Boston | Median ≈ $2,486 |
| Roxbury | Median ≈ $2,550 |
| Mattapan | Median ≈ $2,440 |
| Roslindale | Median ≈ $2,200 |
These gaps open the door to upgrade strategies (renovations, repositioning) in sectors still affordable on a Boston scale.
Rules of the game: taxation, regulation, public programs
Investing in Boston real estate is not just about analyzing rents and purchase prices. Understanding the tax and regulatory framework is essential, especially since the city heavily uses urban planning, taxation, and planning to guide its development.
A tax system heavily reliant on property
More than 70% of the city’s operating budget is funded by property taxes. The total value of taxable property reaches approximately $226 billion. The net levy expected for 2026 is around $3.47 billion.
Property tax rates vary by property type:
| Fiscal Year | Residential Rate (per $1,000) | Commercial/Industrial Rate (per $1,000) |
|---|---|---|
| FY 2024 | $10.90 | $25.27 |
| FY 2025 | $11.58 | $25.96 |
| FY 2026 (projected) | $12.40 | $26.96 |
The city exploits the possibility offered by state law (Proposition 2½) to place more of the tax burden on the commercial sector: office buildings, retail, industrial properties, and certain non-residential properties pay up to 175% of their theoretical tax share, which lightens the burden on households.
A proposed reform seeks to temporarily push the commercial share to 200% in order to contain the rise in residential taxes, illustrating how Boston uses the tax tool to balance residential attractiveness and economic competitiveness.
Michelle Wu, Mayor of Boston
Urban planning: zones, inclusion policies, and office conversions
The Boston Planning and Development Agency (BPDA) is the key body for any major development or renovation project. Since 2022, it has approved over 170 projects, representing around 13,000 new homes, including more than 4,000 rent-restricted units.
Several recent changes are crucial for investors:
Number of potential housing units, including 284 affordable ones, generated by Boston’s office-to-residential conversion program.
For an investor, these policies mean several things: large purely tertiary operations are more regulated, residential (especially affordable) is encouraged, and the conversion of obsolete buildings is becoming a serious avenue, supported by the city.
Housing Accelerator and dedicated funds
Aware of the housing deficit, the municipality has established a Housing Accelerator Fund that will receive a massive injection (about $110 million) to unlock operations awaiting financing. It provides equity in multifamily projects and works in conjunction with a state fund, the Momentum Fund, itself part of a $5.1 billion plan for affordable housing.
The massive Bunker Hill rehabilitation project in Charlestown – moving from about 1,110 public housing units to a mixed community of 2,699 units – is the first operation to benefit from this mechanism.
For the private investor, these instruments may seem remote at first glance. But they are structuring: they help create additional supply, often subsidized, which can stabilize certain neighborhoods, create new centralities, and clarify the framework for private sector involvement.
Flagship projects: how the city is reshaping itself
Boston is literally rebuilding upon itself. Several mega-projects, already launched or underway, are fundamentally reconfiguring the map of the city and its metro area.
South Station Tower: mixed-use and atop a transport hub
The South Station Tower illustrates the scale of Boston operations: a 51-story mixed-use tower, one million square feet, built directly above a major multimodal train station. This approximately $1.5 billion project includes:
– offices (about 685,000 square feet),
– luxury residences by Ritz‑Carlton (166 condos, from $1.3 to $14 million),
– hotel,
– retail,
– sky park on the 11th floor with pool.
Two major office tenants – an international law firm and an insurance company – have already signed leases for several tens of thousands of square feet, confirming the appeal of these premium buildings.
Winthrop Center, Fenway Center, Seaport Square: the vertical city and biotech
Winthrop Center is one of the largest vertical developments in Boston’s history, with over 1.8 million square feet. It includes 317 residences, 812,000 square feet of office space, retail, and remarkable amenities (indoor pool, extensive co-working and lounge spaces). The building is presented as the largest office tower meeting the “Passive House” standard in the world, with prestigious tenants in consulting, finance, and auditing.
The increase in the value of neighboring properties since the start of construction on the Fenway Center project in 2018.
The Seaport, meanwhile, is planned through a masterplan (Seaport Square) transforming a former port waterfront into a district of mixed-use towers. More than 350 companies are based there, with a mix of offices, labs, hotels, retail, and residences.
Suffolk Downs, Dorchester Bay City, Union Point: new “pieces of city”
Suffolk Downs, a former 161-acre racetrack, is becoming a new neighborhood straddling Boston and Revere. The project ultimately plans about 10,000 homes, 5 million square feet of commercial space, 40 acres of parks, plazas, bike paths, and neighborhood retail, all linked to the Blue Line subway. On the Boston side, nearly 7,000 homes are planned, with 20% rent-restricted.
Number of affordable housing units planned in the Dorchester Bay City project, out of a total of nearly 2,000 units.
On the southern periphery, Union Point (South Weymouth) is a planned new town on 1,400 acres of former military land, with 4,000 projected homes and hundreds of thousands of square feet of retail, all connected by commuter rail to downtown Boston.
For an investor looking to position for the long term, these projects are strong signals: they set future centralities and indicate value axes (transit, functional mix, green spaces).
Commercial real estate: offices, retail, industrial, and labs
Beyond residential, investing in Boston real estate also means looking at the commercial market, which stands out for its diversity and its strong “life sciences” component.
Cap rates, rents, and asset typology
The available data paints a picture of a commercial market that is generally expensive, but offers reasonable returns by the standards of a major U.S. metro area:
| Indicator | Approximate Value |
|---|---|
| Average price per square foot (CRE) | ≈ $594 |
| Average size of commercial assets | ≈ 24,547 sq ft |
| Largest available asset | ≈ 1,144,789 sq ft |
| Average cap rate (CRE overall) | ≈ 6.04% |
| Office cap rate (Class A) | ≈ 5.0–6.0% |
| Retail cap rate | ≈ 6.0% |
| Industrial cap rate | ≈ 5.5% |
| General cap rate range | 5.0–6.5% |
| Class A office rents (downtown and prime) | $55–75/sq ft/year |
| Office rents (broad range) | $30–75/sq ft/year |
| Typical retail lease term | 5 to 10 years |
| Average CRE closing timeline | 60–90 days |
| Tenant improvement (TI) allowances | $30–80/sq ft |
Boston has launched a large wave of office development in recent years, driven largely by the life sciences sector. At one point, it led the nation with a pipeline of 8.7 million square feet of office space, concentrated in Cambridge, Seaport, and Fenway. The pandemic and remote work have shaken demand, especially for lower-quality offices, but appetite for high-end or specialized spaces (labs, R&D) remains very strong.
In this context, professional investors often favor: long-term investments.
– ultra-well-located Class A offices (Back Bay, Seaport, Kendall, Downtown),
– labs and research buildings (Fenway, Longwood, Cambridge, Seaport, Somerville),
– logistics and industrial assets on the periphery, driven by e-commerce.
Retail and hospitality, after a trough during Covid, are again showing signs of strength, especially in densely populated and tourist neighborhoods.
Key players and services
The Boston commercial market is highly institutionalized. Many global and regional players operate here:
Overview of the main companies and brokers specializing in the commercial real estate and asset management market in Boston and New England.
Boston office, regional hub. Services: transaction, leasing, asset management, and research.
Offers offices, retail, and warehouses (lease/purchase). Flexible solutions: NNN, full service, build‑to‑suit, subleases.
Boston City Properties, Boston Realty Advisors, Hunneman, National Commercial Brokers, Boston Urban Partners, among others, manage significant local portfolios.
Based at One Boston Place. Manages +$10.7B in assets ($34B invested across 370+ transactions). Specialization: value-add, opportunistic, multifamily, senior debt, and sophisticated financial/legal structuring.
For the investor, this means access to a wide range of services: financing, asset management, property management, leasing, improvement of underperforming buildings, etc.
Residential investment strategies: long term, multi-family, and short-term rental
At the residential level, several strategies coexist in Boston, but all must contend with high construction and renovation costs, strict zoning rules, and, in the case of vacation rentals, very tight regulations.
Buy-to-rent long-term: the market’s backbone
The “buy & hold” strategy remains the most common: purchase a property (often multi-family), rent it out long-term, and rely on both moderate but stable cash flow and capital appreciation.
The available figures allow for modeling typical cases:
– Median home price in Boston: $800,000 to $850,000.
– Average monthly rent: a little over $3,200.
– Average gross yield: around 4.5% to 5%.
Of course, actual profitability depends on the financing structure. For example, a $400,000 loan at 7% over 30 years implies a monthly payment around $2,660; a $300,000 loan around $1,995.
Investors typically aim for a cash‑on‑cash return of 8 to 12%, which, given Boston prices, requires:
To optimize an investment, it is advisable to negotiate acquisition prices or target affordable neighborhoods, estimate renovation costs ($50–75/sq ft for light work, $100–150/sq ft for full rehabilitation), leverage tax benefits like mortgage interest and depreciation, and consider value-add projects such as change of use or densification.
Multi-family and triple-deckers: Boston’s DNA
Multi-family buildings (2 to 3 units, sometimes more) and the famous triple-deckers are an iconic typology. They are very common in Dorchester, Roxbury, Mattapan, East Boston, Allston‑Brighton, Jamaica Plain, Roslindale, etc.
Investing in these assets allows:
– pooling vacancy risk (multiple rents instead of one),
– building a portfolio on the scale of a single block,
– leveraging energy renovation and inclusion programs when creating or preserving affordable housing.
This is the FHA financing limit for a triplex in Boston, allowing significant leverage subject to partial owner occupancy.
Short-term rental: a heavily restricted regime
Boston has adopted a very strict policy toward Airbnb-type rentals. The stated goal is clear: prevent housing from being permanently removed from the residential market in favor of short-term rentals and protect the long-term housing stock.
The main principles of the Boston regime are as follows:
Only the primary residence, occupied by the owner for at least 9 months per year, is eligible. Regulated or subsidized housing is excluded. Three types of licenses exist (Limited Share, Home Share, Owner‑Adjacent), and purely rental investors are prohibited from operating legally in this sector.
Obligations are numerous: mandatory registration with the city, business certificate, display of license number on listings, notification of neighbors, strict compliance with safety codes (smoke detectors, CO, fire extinguishers, emergency exits), adequate insurance coverage, etc.
Taxation is also in the spotlight:
| Applicable Tax | Indicative Rate |
|---|---|
| MA State Occupancy Tax | 5.7% |
| City of Boston Local Tax | 6.5% |
| Convention Center Financing Surcharge | 2.75% |
| Possible “Community Impact Fee” | Up to 3% |
In total, the tax burden on a night’s stay can therefore approach 15 to 18%. Platforms like Airbnb often collect these taxes on behalf of hosts, but hosts remain responsible in case of non-compliance.
Enforcement of the regulations is particularly active: authorities have already issued several hundred fines of $300 per day and regularly shut down illegal listings. For an investor, this means that “wild” short-term rentals are not a viable option in Boston. However, an owner-occupant can, if they strictly follow the rules, generate significant additional income.
The role of REITs and collective investment vehicles
Faced with such an expensive and sophisticated market, many international investors choose to access the Boston market via collective vehicles, particularly Real Estate Investment Trusts (REITs) or private funds.
REITs, created by the U.S. Congress in 1960, must distribute at least 90% of their taxable income and invest at least 75% of their assets in real estate or cash. Nationwide, they hold approximately $4.5 trillion in real estate assets, with over $3 trillion in publicly traded or non-traded REITs.
Several major REITs and managers are rooted in the Boston region:
An overview of the main real estate companies headquartered in the Boston area, detailing their specialties and target markets.
One of the largest premier office developers, based at the Prudential Center. Specializes in “gateway” markets like Boston.
Focuses on single-tenant warehouses and industrial properties across the United States.
Targets offices in downtowns of the Sunbelt and Mountain West. Headquarters in Massachusetts.
Boston Capital, TA Realty, The RMR Group, Northland, Wingate, etc. Manage residential, office, and retail portfolios, sometimes on a national scale.
For an investor who wants to benefit from Boston’s dynamic without buying a building directly, these instruments – along with real estate index funds (such as ETF VNQ) or non-traded funds – provide a more liquid and less capital-intensive access route.
2025–2026 Outlook: a market rebalancing without collapsing
Recent analyses converge on one diagnosis: the current period is a transition phase.
On one hand, interest rates have risen sharply compared to the previous decade, freezing part of the market (owners reluctant to give up their 3% mortgages, buyers waiting on the sidelines). Building permits have dropped about 44% between 2021 and summer 2025, suggesting a shortage of new supply for 2026‑2027.
The city maintains its appeal for students, researchers, engineers, and executives, supported by new infrastructure projects (transit, coastal resilience, major facilities) that boost its economy. Real estate prices, meanwhile, are no longer soaring but are rising moderately or stabilizing, accompanying a change in purchasing behavior.
– Sellers are losing some of their bargaining power and must adjust prices to the market.
– Buyers are returning, more thoughtful, less inclined to waive inspections or overpay.
– The early part of the year is becoming more active, with some owners preferring to get ahead of spring competition.
– The condo market appears more flexible than that of single-family homes, whose supply remains extremely scarce.
The city of Boston is undertaking a comprehensive revision of its zoning, tax, and housing regulations. The main goal is to increase housing construction, including affordable units. This effort is part of ambitious climate objectives, notably achieving carbon neutrality by 2050, expanding accessory dwelling units (ADUs), and implementing net-zero energy zoning.
For the investor, this means success will not rest on short-term speculation, but on:
– a fine-grained reading of the neighborhood fabric (transit, upcoming projects, social dynamics),
– mastery of regulatory constraints (zoning, inclusion, taxes, short-term rentals),
– prudent management of leverage (with interest rates expected to stabilize around 6% in the medium term),
– and, above all, a long-term vision.
Conclusion: how to approach investing in Boston
Investing in Boston real estate is not about seeking an easy “flip”, but building a patient strategy in a mature, complex, and competitive market. Nevertheless, a few key takeaways emerge:
Central premium neighborhoods are safe but expensive. Transitioning areas offer opportunities with conditions. Multi-family assets help smooth risks. Short-term rentals are heavily regulated. The commercial market, while promising, requires expertise.
In this setting, the savvy investor will seek less to “beat the market” than to enter it intelligently, relying on data, seasoned professionals, and a clear understanding of the dynamics at work: neighborhood transformation, rebalancing between offices and housing, strengthening of affordable housing policies, and adaptation to coastal climate risks.
Boston’s economy, built on knowledge, university density, and health and research hubs, ensures international appeal and lasting stability, making a sudden market collapse unlikely. However, these advantages translate into high real estate costs. It is possible to invest directly by buying a property (such as a triple-decker in Dorchester) or indirectly via shares of REITs that own buildings in the city.
Disclaimer: The information provided on this website is for informational purposes only and does not constitute financial, legal, or professional advice. We encourage you to consult qualified experts before making any investment, real estate, or expatriation decisions. Although we strive to maintain up-to-date and accurate information, we do not guarantee the completeness, accuracy, or timeliness of the proposed content. As investment and expatriation involve risks, we disclaim any liability for potential losses or damages arising from the use of this site. Your use of this site confirms your acceptance of these terms and your understanding of the associated risks.

Cyril Jarnias is an independent expert in international wealth management with over 20 years of experience. As an expatriate himself, he is dedicated to helping individuals and business leaders build, protect, and pass on their wealth with complete peace of mind.
On his website, cyriljarnias.com, he shares his expertise on international real estate, offshore company formation, and expatriation.
Thanks to his expertise, he offers sound advice to optimize his clients' wealth management. Cyril Jarnias is also recognized for his appearances in many prestigious media outlets such as BFM Business, les Français de l’étranger, Le Figaro, Les Echos, and Mieux vivre votre argent, where he shares his knowledge and know-how in wealth management.





