
 Published on and written by Cyril Jarnias
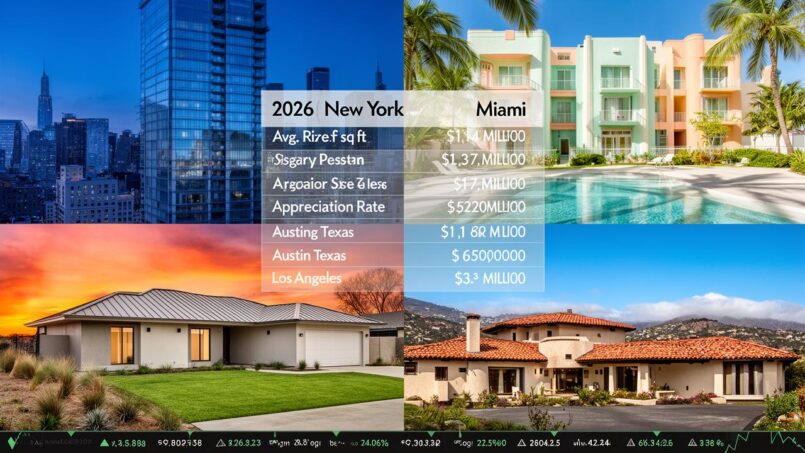
In 2026, discussing real estate prices in the United States inevitably means comparing several “worlds” that coexist within the same country. New York, Miami, Austin, and Los Angeles are neither in the same price category nor the same cycle timing. Yet these four markets respond to, observe, and sometimes correct simultaneously.
Between perceived bubbles, ongoing corrections, capital inflows, and purchasing power constraints, 2026 is shaping up to be a year of ‘reset’ rather than boom or crash. The main question: where to buy, at what price, and with what prospects for appreciation or rental yield.
A U.S. market in “major reset”
Before diving into the details of the four cities, we need to set the national landscape. Several major players—Zillow, Redfin, the National Association of Realtors (NAR), Fannie Mae, and J.P. Morgan Global Research—converge on one scenario: 2026 marks the beginning of a gradual normalization.
The broad outlines are relatively clear. 30-year mortgage rates will remain high by recent historical standards, but less volatile than during the post-pandemic shock. Most forecasts place them in a range of 5.9% to just over 6% on average for the year, far from the 3% that fueled the 2020-2021 frenzy, but below the 2023-2024 peaks.
The National Association of Realtors projects about a 4% increase in the median home price in 2025.
Sales volumes are expected to recover slightly after several anemic years. According to the NAR, existing home sales could rise by about 3%, reaching an annualized pace of around 4.2 million transactions. Zillow forecasts an increase of about 4.3% in existing sales compared to 2025, while Realtor.com mentions a rise of close to 1.7%.
The underlying message is simple: the “major reset” won’t come from a brutal crash, but from a long period where wages finally grow faster than home prices. Several forecasts emphasize that in 2026, for the first time since the Great Financial Crisis, incomes are expected to rise faster than home values over an extended period. This leads some analysts to speak of a beginning of improved affordability, even if the weight of the monthly payment remains heavy for many households.
In this rebalancing landscape, New York, Miami, Austin, and Los Angeles are at very different stages of the cycle, with specific risks and opportunities.
New York: Unapologetically expensive, resilient market
New York remains one of the most expensive markets in the country, but also one of the most resilient. In 2026, the city is in a stabilization phase after the pandemic overheating and the rate shock. Prices continue to rise, but at a more moderate pace.
Prices, dynamics, and market tightness
At the aggregate level, the average home value in New York is around $816,000. Over one year (data as of April 30, 2026), this represents an increase of about 4.4%. The median sale price is around $773,000, while the median listing price is approximately $858,000. In other words, sellers are asking more than what is actually closing, as confirmed by the median sale-to-list price ratio of about 0.977.
The market remains active: a property takes an average of 65 days to go “pending.” Nearly 19.4% of sales close above the asking price, while 67.8% close below, indicating a market where negotiation is common but well-positioned properties can still attract competition.
With only 16,700 homes for sale and 3,760 new listings, the market is far from saturated, which prevents prices from falling despite rising rates.
A softer spring 2026, but no turnaround
April 2026 data illustrates this plateau well. New York recorded about 3,479 sales in the month, a 7.3% decrease from the previous year, at a time when national sales edged up slightly (+0.6%). New listings increased by about 13.4% year-over-year, but inventory only grew by 1.4%. The market is still absorbing a good portion of the supply.
In terms of prices, the median in April reached $730,000, a limited increase of 0.7% year-over-year, while the national median price rose 1.7% to about $390,000. In other words, New York remains about 87% more expensive than the U.S. median, but the increase is now slower than in other regions.
Single-family homes saw their median price rise to $805,000, an increase of $25,000 year-over-year, while townhouses and condos recorded declines of -4.1% and -4.8% respectively, illustrating a market where scarce family homes hold their value and more abundant segments begin to correct.
Housing cost exacerbated by taxes
If New York remains one of the most sought-after areas in the country, it is also one of the most tax-burdensome for affluent households. New York State income tax is progressive, ranging from 4% to 10.9% for the highest brackets, and the city adds its own layer, up to 3.876%. The total can thus reach nearly 14.8% for high earners.
Added to this is the mansion tax, a specific transfer tax on residential properties over $1 million, with a progressive rate that can go up to 3.9% above $25 million. In practice, buyer closing costs often run around 2% to 4% of the purchase price, plus the mansion tax. Unsurprisingly, a family earning $1 million per year may pay about $122,000 in state + city income tax, and a household with $5 million annual income could approach $700,000 in aggregate tax burden.
The price per square foot exceeds $1,800 in sought-after neighborhoods, making the total cost of ownership very high.
Still solid demand in the high end
Despite this, the New York market remains one of the global poles of ultra-luxury. A very significant portion of the inventory is above $1 million, to the point where the metro area consistently ranks in the national top three for absolute number of million-dollar-plus homes. Around 2025, New York had more than 9,200 listings in this range, and in April 2026, there were over 11,500 million-dollar properties in the metropolitan area.
Prices in this segment are far from collapsing. In Manhattan luxury ($3 million and above), the price per square foot ranges between $2,200 and $3,500. Even though inventories have contracted slightly and co-ops—which represent about 70% of the stock—remain less open to international buyers, demand remains robust, particularly for “turn-key” properties with high-end services and sought-after amenities (gyms, terraces, coworking spaces, pet services, etc.).
Thus the short-term outlook: 2026 is seen by analysts as a “true beginning of a rebound,” with a recovery in transaction volume and more measured but present price growth, driven primarily by luxury and new construction.
Miami: Growth under watch, between boom and overheating risk
In Florida, Miami occupies a unique place. The metro area is both one of the most dynamic markets in the United States and one of the most watched due to a bubble risk deemed high by several international indicators.
High prices but still moving
In 2026, the typical home value in Miami is around $581,000, down about 1.6% year-over-year according to data as of April 30, 2026. Meanwhile, the median sale price is around $603,000, while the median listing price is higher, close to $650,000. The majority of sales (about 80%) close below the asking price, and only 7.4% close above the initial list price, signaling a market already more favorable to buyers than New York.
The median days to pending is about 57 days. This is far from the pandemic-era frenzy, but the market remains fluid. At the broader metropolitan level (Miami–Fort Lauderdale–West Palm Beach), the average value is around $476,000, down about 3.7% year-over-year as of mid-2025, according to estimates.
For single-family homes in Miami-Dade, the median is around $590,000 to $700,000 depending on source and date. In April 2025, the median home price there was already $590,000, up +6.3% year-over-year; in January 2026, the median for single-family homes was $699,990, up 3.7% year-over-year. Condos, by contrast, have a median around $400,000, with occasional slight declines in certain segments.
Rare intensity of luxury demand
The high end remains a key driver. Homes over $3 million show no signs of slowing down. In residential luxury (over $3 million for homes, $2 million for condos, $10 million for ultra-luxury, $25 million for mega-properties), the median sale price in the prestige segment was around $4.85 million in Q1 2026, up 3.2% year-over-year, with a price per square foot of about $1,245, up +2.8%.
About 67% of luxury transactions are all-cash, a slight decline from the 71% average over the past five years.
Iconic micro-markets—Coral Gables, Key Biscayne, Miami Beach—continue to set records. In Coral Gables, the average sale price in Q1 2025 reached $3.76 million, up 27% year-over-year, with a median of $2.52 million (+44.6%) and a price per square foot exceeding $1,020, up 13%. The number of sales over $1 million rose by nearly 4%, and the dollar volume of this segment increased by 4.5%.
In new luxury construction, prices are soaring: projects like 14 River District or The Gale Miami Hotel & Residences have price ranges from about $500,000 to over $1.6 million for apartments, with an average price per square foot for luxury condos exceeding $1,000 (record around $1,080/sq ft for some projects).
Miami, the U.S. capital of million-dollar-plus listings
One of the major shifts in the U.S. luxury market occurred at the end of 2025: Miami briefly surpassed New York in absolute number of homes priced at $1 million or more. At that time, the Florida metro had about 10,513 listings above this threshold, compared to 9,216 for New York. In April 2026, New York regained the lead in absolute inventory, but Miami remains in the top two and dominates when these figures are adjusted for market size.
About 26% of the luxury demand flow to Miami comes from the New York metro area, exceeding the total from the next eight combined sources.
A tax haven… attracting New York capital
The tax cost differential plays a huge role in this migration. Florida levies no state income tax, while New York combines state and city taxes to reach marginal rates above 14% for very high incomes. A household earning $300,000 per year can save $25,000 to $35,000 annually in taxes by relocating to Miami instead of New York; at $500,000 income, the savings climb to between $40,000 and $55,000 per year, and over ten years, a household with $1 million annual income could theoretically save more than $1.2 million in tax burden by living in Florida rather than Manhattan.
Added to this are mechanisms like the homestead exemption which reduces the taxable base by up to $50,000, the annual cap on taxable value increases at 3% (Save Our Homes), and the absence of state-level inheritance tax. In a context where the typical value of an apartment in downtown Miami is between $550,000 and $800,000 for a two-bedroom, with a price per square foot of $600 to $900, the cost-tax ratio remains often far more favorable than in the Northeast.
A clearly identified bubble risk
This attractiveness, however, has a downside: several international indicators consider Miami one of the most overheating markets in the world. The UBS Global Real Estate Bubble Score gives Miami a score of 1.73, above the 1.5 threshold characterizing high bubble risk, and even above the 2006 peak. Miami, along with Los Angeles, appears as the most exposed U.S. city.
The inventory of condos over $1 million now represents more than 23 months of supply, up from 17.6 months a year earlier, signaling a buyer’s market.
Despite these signals, most major institutions (MIAMI Realtors, Realtor.com, Fannie Mae) do not anticipate a crash. Projections instead point to a continued rise in single-family home prices at a rate of 2.8% to 4% per year over 2026-2027, with the condo market absorbing more slowly but potentially returning to slight growth by 2027 after passing through modest declines.
2026 forecasts: more sales, few declines
Major forecasts for Miami converge on a scenario of stable to slightly rising prices in 2026, with a rebound in volumes. MIAMI Realtors projects for all of Southeast Florida an increase of about 4.9% in single-family home sales in 2026 and 5.4% in 2027, after four years of decline. Median home prices are expected to rise about 2.8% in 2026 and then 3.5% in 2027. Condo sales, however, could still decline slightly in 2026 (–5.3%), before a faint positive uptick of 0.2% in 2027.
On the financing side, MIAMI Realtors expects an average 30-year rate around 6% in 2026, with a possible decline to 5.8% by end of 2026, then 5.7% by end of 2027. On a $500,000 home, a 30 basis point drop in rate equates to about $87 in monthly savings on the mortgage payment, which does not radically transform affordability but improves the situation at the margin.
Finally, the local macro-economic dynamic remains favorable: projections speak of a cumulative real wage increase of nearly 10% per year between 2025 and 2027 in the Miami region, which can absorb part of the rise in home prices and support demand, in a context where the 2026 World Cup and continued immigration of talent and capital (notably from New York and Latin America) should consolidate the city’s appeal.
Austin: Severe correction, entry point for patient buyers
At the opposite end of the ultra-expensive coastal megacities, Austin is an illustration of a market that paid dearly for its pandemic frenzy. Between 2022 and 2025, the Texas capital suffered one of the steepest corrections in the country, to the point that in 2026, many analysts see it as a laboratory for a “return to reason” after the euphoria.
From overvaluation to near undervaluation
According to cross-referenced data from Zillow and Reventure analyses, Austin reached its price peak around May 2022, with a typical value close to $552,000 to $553,000. Since then, the market has dropped about 24%, bringing the typical value to around $420,000 at one point, a decline of about $130,000.
This correction has erased nearly five years of gains: prices have returned to levels comparable to May 2021, so that one can consider there has been no net price gain over five years in nominal terms. Meanwhile, affordability has improved significantly.
In 2026, several data series coexist but paint the same trend. The average home value in Austin is around $511,000 to $513,000, down about 5.7% to 6.8% year-over-year depending on the index. The median sale price is in a range of $530,000 to $542,000 in spring 2026, with a median price per square foot close to $313, down nearly 7% year-over-year.
The median sale price in the Austin metro area in March 2026, down about 3% from the previous year.
A deep but accepted correction
The same story appears in long-term perspective: between Q4 2025 and the 2022 peak, the median price went from about $550,000 to $440,000, a correction of about 18 to 20%. The price per square foot in that period (Q4 2025) stands between $265 and $280, compared to much higher levels at the cycle peak. Reventure figures mention a market that was overvalued by nearly 40% at the end of 2021, and is now only slightly overvalued (about +2.7%) in 2026, with the prospect of turning into undervaluation if prices fall a few more points.
Symptoms of a market in digestion are visible: the average days on market peaked at 90 days at the end of 2025, the highest in a decade. By late spring 2026, this figure is down to around 48 to 58 days depending on the segment, but it remains significantly longer than during the boom. Some pockets, like East Austin, have already lost about 21% from their peak, and projections still point to an additional 7% year-over-year decline in these neighborhoods.
A window of opportunity… to be handled with caution
For buyers, this correction opens an unprecedented window compared to saturated coastal markets. The median price in the metro area, at $426,000 in March 2026, is slightly above the national median (about $426,000 as well according to Statista for Q2 2026), but with a cost of living about 4% below the national average. Relative to Austin’s techno-economy, this price-to-income ratio is more reasonable than in 2022.
Several organizations—Texas A&M Real Estate Center, local data providers, major national portals—converge on the following scenario for 2026:
– another 1 to 3% price decline in the first half of the year;
– a probable bottom around the third or fourth quarter of 2026;
– stabilization, then a moderate price recovery starting in 2027, with annual increases of about 1 to 3% initially, followed by a possible acceleration to 5 to 7% per year by 2027-2030, according to the most optimistic forecasts (Fannie Mae mentions up to 30% cumulative increase over four years on the high end of the national range, with about 8.9% median growth from 2026 to 2030).
Reventure, widely followed by individual investors, predicts that its model will trigger a “buy signal” on Austin within the next 3 to 6 months, as the residual overvaluation dissipates. The market remains fragile, however: inventory still high, number of price cuts above normal, many neighborhoods where declines are not over. The southern area (Hays County), for example, is forecast to drop a further nearly 4.7%.
Analysts predict a 2026 characterized as a buyer’s market: well-prepared sellers priced correctly will sell, while others will be left out. The median closing price is expected to increase +1% to +3% year-over-year, with strong disparities across submarkets. No credible expert anticipates either a brutal collapse or a new boom in the short term.
Austin vs. Los Angeles: A chasm in cost of living
Comparison with Los Angeles shows just how much Austin, despite its long-term rise, remains relatively affordable within the ecosystem of major U.S. cities. According to cost-of-living indices, Austin is roughly at the national average (index 100), while Los Angeles often exceeds 160 to 170 points, meaning 60 to 70% more expensive.
Concretely, an average home in Los Angeles costs about $1.35 million according to some estimates, more than 60% more than in Austin, where a “typical” home is around $494,000 to $511,000. Rents follow the same logic: a two-bedroom apartment averages about $1,995 per month in Austin, compared to $2,660 in Los Angeles; a one-bedroom is around $1,685 in Austin, versus over $2,130 in Los Angeles. Overall rental market, the average rent in Austin (about $1,567) is more than a third lower than in Los Angeles.
For purchasing, the price per square foot of a downtown apartment is about $392 in Austin, compared to over $700 in Los Angeles. In the suburbs, the gap widens further ($282/sq ft vs. over $600 in Los Angeles). That explains why, at equal salary, a household earning $150,000 lives much more comfortably in Austin than in Los Angeles: they would need about $211,000 in Los Angeles to maintain the same standard of living as with $150,000 in Austin.
In this light, the recent correction in Austin is not just bad news; it repositions the city as a relatively affordable alternative to coastal metros, provided one accepts a less directional market phase in 2026.
Los Angeles: A rationed luxury, between modest increase and affordability constraint
At the other geographical and economic extreme, Los Angeles illustrates a market where high cost is no longer debated, but where the 2026 dynamic is more one of “controlled cooling” than a brutal reversal.
High prices, structural overvaluation
According to Zillow data, the average home value in Los Angeles is around $956,000 as of late April 2026, down about 1.2% year-over-year. Other sources cite a median value around $885,000 for homes, with a slightly negative annual change (–3.4%), but up nearly 13% over five years. The general range of values in the metro area spans widely from $531,000 to over $3 million.
Asking prices remain colossal: the median list price exceeds $1 million (around $1.05 to $1.19 million in early 2026), while the median actual sale price is around $981,000 in some reports. The market appears largely overvalued relative to local incomes: some valuation models mention an overvaluation level of nearly 188% relative to income fundamentals.
This imbalance translates into affordability: to buy a median home in the Los Angeles metro area, an income of about $280,000 per year is needed, which effectively excludes the majority of households.
An active but stretched market in time
Despite these price levels, the market is not paralyzed. In April 2026, the median price in the Los Angeles metro area is about $860,000, up slightly by 1.2% year-over-year, while in Los Angeles County the median is around $845,000, down slightly (–0.6%). Listing inventory remains tight: around 14,800 to 15,300 homes for sale in early 2026, up notably from 2025, but month-over-month growth is beginning to slow.
In March 2026, the median days on market reached 50 days, an increase of over 13% year-over-year.
Structurally limited supply
The paradox of Los Angeles is that this price firmness comes not from explosive demand, but from chronic supply shortage. Inventory indicators, even if rising, remain far below what is seen in looser markets like Austin or some Midwestern metros. New listings even decline in some months (–8.1% in new listings in March in one series), while the rest of the country begins to see supply replenish.
This range corresponds to the projected annual home price appreciation in 2026, with a more pronounced trend in the most desirable segments.
Cost of living: Los Angeles champion of exorbitant prices
Compared to Austin, the California megalopolis highlights the geographic fracture in cost of living in the United States. Several indices point to an overall cost about 35 to 40% higher in Los Angeles than in Austin, with far more dramatic gaps in housing: housing expenses are almost 170% higher in Los Angeles on average. In absolute terms, this means nearly $4,900 more per month for housing in Los Angeles compared to Austin, for a comparable amount of space.
In Los Angeles, the median studio rent is 56% higher than in Austin, at about $2,800/month versus $1,800/month in 2026.
Between local bubbles and overall inertia
Los Angeles shares with Miami an unenviable status: that of a U.S. market considered at high bubble risk by the UBS indicator. This does not mean a crash is guaranteed, but it warns of a price/income ratio that has become very strained. In practice, major institutions (NAR, Zillow, Realtor.com) nevertheless expect neither a brutal collapse nor a further price surge. Most projections for Los Angeles in 2026 speak of contained increases (3 to 5% according to some studies) driven by the high end, with a market base that remains supported more by supply scarcity than by speculative frenzy.
It is precisely this scarcity that protects the market from a deep correction. New construction is limited, available land is scarce and expensive, and regulatory constraints are significant. As long as employment and higher incomes hold, solvent demand for multi-million-dollar properties will remain sufficient to sustain values in the most sought-after neighborhoods.
Comparative tables: Where do New York, Miami, Austin, and Los Angeles stand?
To make these price gaps and dynamics more readable, it is useful to juxtapose some key indicators for the four markets.
Price levels and recent trends
| City | Indicative average/median value (home) | 1-year change (approx.) | 2026 comment |
|---|---|---|---|
| New York | ~$816,000 (avg value); $773,000 (median sales) | +4 to +5% | Expensive market, still rising but slower, strong segmentation between homes, condos, co-ops |
| Miami | ~$581,000 (typical value); $603,000 (median sales) | –1 to 0% overall; +3 to +4% on homes | Slight overall softening, marked robustness of single-family homes, condos more fragile |
| Austin | ~$512,000 (avg value); $426–542,000 (medians by scope) | –3 to –7% | Deep correction underway since 2022, still searching for a bottom |
| Los Angeles | ~$956,000 (avg value); ~$885–981,000 (medians) | –1 to –3% | Slight decline after years of increase, strong overvaluation relative to incomes |
Days on market and buyer/seller balance
| City | Median days to pending | % of sales above asking price | Balance of power |
|---|---|---|---|
| New York | ~65 days | ~19% | Tight market, well-positioned properties sell quickly, slight negotiation room for rest |
| Miami | ~57 days | ~7% | Market more favorable to buyers, heavy negotiation on majority of properties |
| Austin | ~48–58 days (up to 90 days end 2025) | ~14% | Transitioning market, buyers more demanding, sellers in weaker position except prime units |
| Los Angeles | ~47–61 days | ~34% | Structurally limited supply, strong competition for quality properties, but days on market rising |
Relative cost compared to U.S. average
| City | Ratio to national median price (~$426,000) | Ratio to national cost of living (index 100) | Comment |
|---|---|---|---|
| New York | ≈ +87% | >100 (city generally more expensive than average) | Very high location premium, supported by employment base and international status |
| Miami | ≈ +30–40% | ~110–120 (depending on categories) | Growing cost, but still far from NY/LA levels, very favorable tax regime |
| Austin | ≈ +0–10% (depending on period) | ~100 (4% below national average on some estimates) | Median position, better purchasing power than large coasts, especially after correction |
| Los Angeles | ≈ +100–120% | 160–170 (68% above average) | Explosive combination of high prices + overall cost of living well above average |
How to read these gaps as a buyer or investor?
Comparing prices alone is not enough to determine where it is “interesting” to buy. For a household or an investor, several structuring questions arise: what holding period? What portion of the purchase is financed? What are the goals (owner-occupancy, rental yield, capital gains)?
In New York, the scarcity value of urban land and global status plays a central role. Paying $1.6 million for a two-bedroom in Manhattan only makes economic sense if one believes in the long-term durability of this metropolitan premium and accepts a very high entry and holding cost (taxes, fees, maintenance). For ultra-wealthy investors or institutional funds, this logic remains valid, especially since the share of cash buyers is significant and overall demand remains supported.
Prices have risen sharply since 2020 thanks to domestic migration, international capital, and favorable taxation. Bubble risks are high: the price/income ratio and monthly cost relative to rents are sometimes hard to justify (buying a starter home cost 41% more per month than renting). However, high incomes and cash buyers, along with a solid luxury market, offer some security. For investing, favor well-located, quality assets rather than betting on broad appreciation.
Austin, meanwhile, shows what a full cycle looks like in a Sun Belt city where prices exploded before correcting. The city in 2026 offers price levels that have become reasonable relative to local wages, with an economy still dynamic. However, the market has not yet fully hit bottom according to most models: a few more points of decline are still expected before a period of stagnation and then slow recovery. This means that a buyer seeking quick capital gains could be disappointed, while one targeting the long term and accepting short-term volatility could find interesting entry points, especially in comparison to coastal costs.
The Los Angeles real estate market is persistently tight due to a housing shortage, high incomes, global appeal, and land/regulatory constraints. Although correction risks exist, a broad collapse is unlikely thanks to supply scarcity and solvent demand. The real problem is affordability: households must make compromises (distance, smaller spaces), while very high earners and investors see it as a trophy market.
2026: No widespread crash, but a sorting by fundamentals
Reviewing the forecasts from major organizations and the detailed data on New York, Miami, Austin, and Los Angeles, a common thread emerges: 2026 is neither the year of a U.S.-style crash nor a new fireworks display fueled by zero rates. It is a sorting year, where the most overexposed markets correct slightly further, while the more affordable or better-managed ones see prices stabilize or even rise modestly.
Three major elements underlie this scenario:
Mortgage rates remain high, averaging between 6.0% and 6.3%, but they have stopped rising, giving buyers more stable visibility compared to the fluctuations of 2022-2023.
– Incomes are finally rising faster than prices in many regions, gradually easing the monthly payment-to-income ratio. Projections indicate that, for the first time since the mid-2000s, the share of income needed for a median mortgage payment could fall back below 30% nationally.
– The housing supply continues to increase, but without tipping into oversupply nationally. Cities like Austin face a relative excess of inventory, while others like Los Angeles or New York remain persistently constrained.
For buyers and investors targeting New York, Miami, Austin, and Los Angeles in 2026, the challenge is no longer to anticipate 20% annual gains, but to assess the sustainability of the location premium, the bubble risk, and the price/income ratio, while factoring in taxes and cost of living, in order to build a ten-year strategy.
The answer will depend less on spectacular announcements about average prices than on a fine analysis of submarkets, neighborhoods, segments (new vs. existing, luxury vs. mid-range), and the ability of each to endure sustainably higher rates. On this front, Austin offers a correction already largely consumed, New York and Los Angeles bet on scarcity, and Miami walks the tightrope between a luxury boom and macro warning signals.
In any case, 2026 will remain the year when the question is no longer just: “How much does it cost?” but also: “Compared to what, and for how long?“
A wealth planning project or a question? Contact us now to speak with a wealth management expert.
Disclaimer: The information provided on this website is for informational purposes only and does not constitute financial, legal, or professional advice. We encourage you to consult qualified experts before making any investment, real estate, or expatriation decisions. Although we strive to maintain up-to-date and accurate information, we do not guarantee the completeness, accuracy, or timeliness of the proposed content. As investment and expatriation involve risks, we disclaim any liability for potential losses or damages arising from the use of this site. Your use of this site confirms your acceptance of these terms and your understanding of the associated risks.

Cyril Jarnias is an independent expert in international wealth management with over 20 years of experience. As an expatriate himself, he is dedicated to helping individuals and business leaders build, protect, and pass on their wealth with complete peace of mind.
On his website, cyriljarnias.com, he shares his expertise on international real estate, offshore company formation, and expatriation.
Thanks to his expertise, he offers sound advice to optimize his clients' wealth management. Cyril Jarnias is also recognized for his appearances in many prestigious media outlets such as BFM Business, les Français de l’étranger, Le Figaro, Les Echos, and Mieux vivre votre argent, where he shares his knowledge and know-how in wealth management.





